Multi-omics Analysis Package - Applications
LC/MS, GC/MS Data Analysis Software

Most of the documents on the LITERATURE is available in PDF format. You will need Adobe Acrobat Reader to open and read PDF documents. If you do not already have Acrobat Reader, you can download it free at the Adobe's Website. Click the GET ADOBE READER icon on the left to download a free copy of Adobe Acrobat Reader.
Data Analysis Example
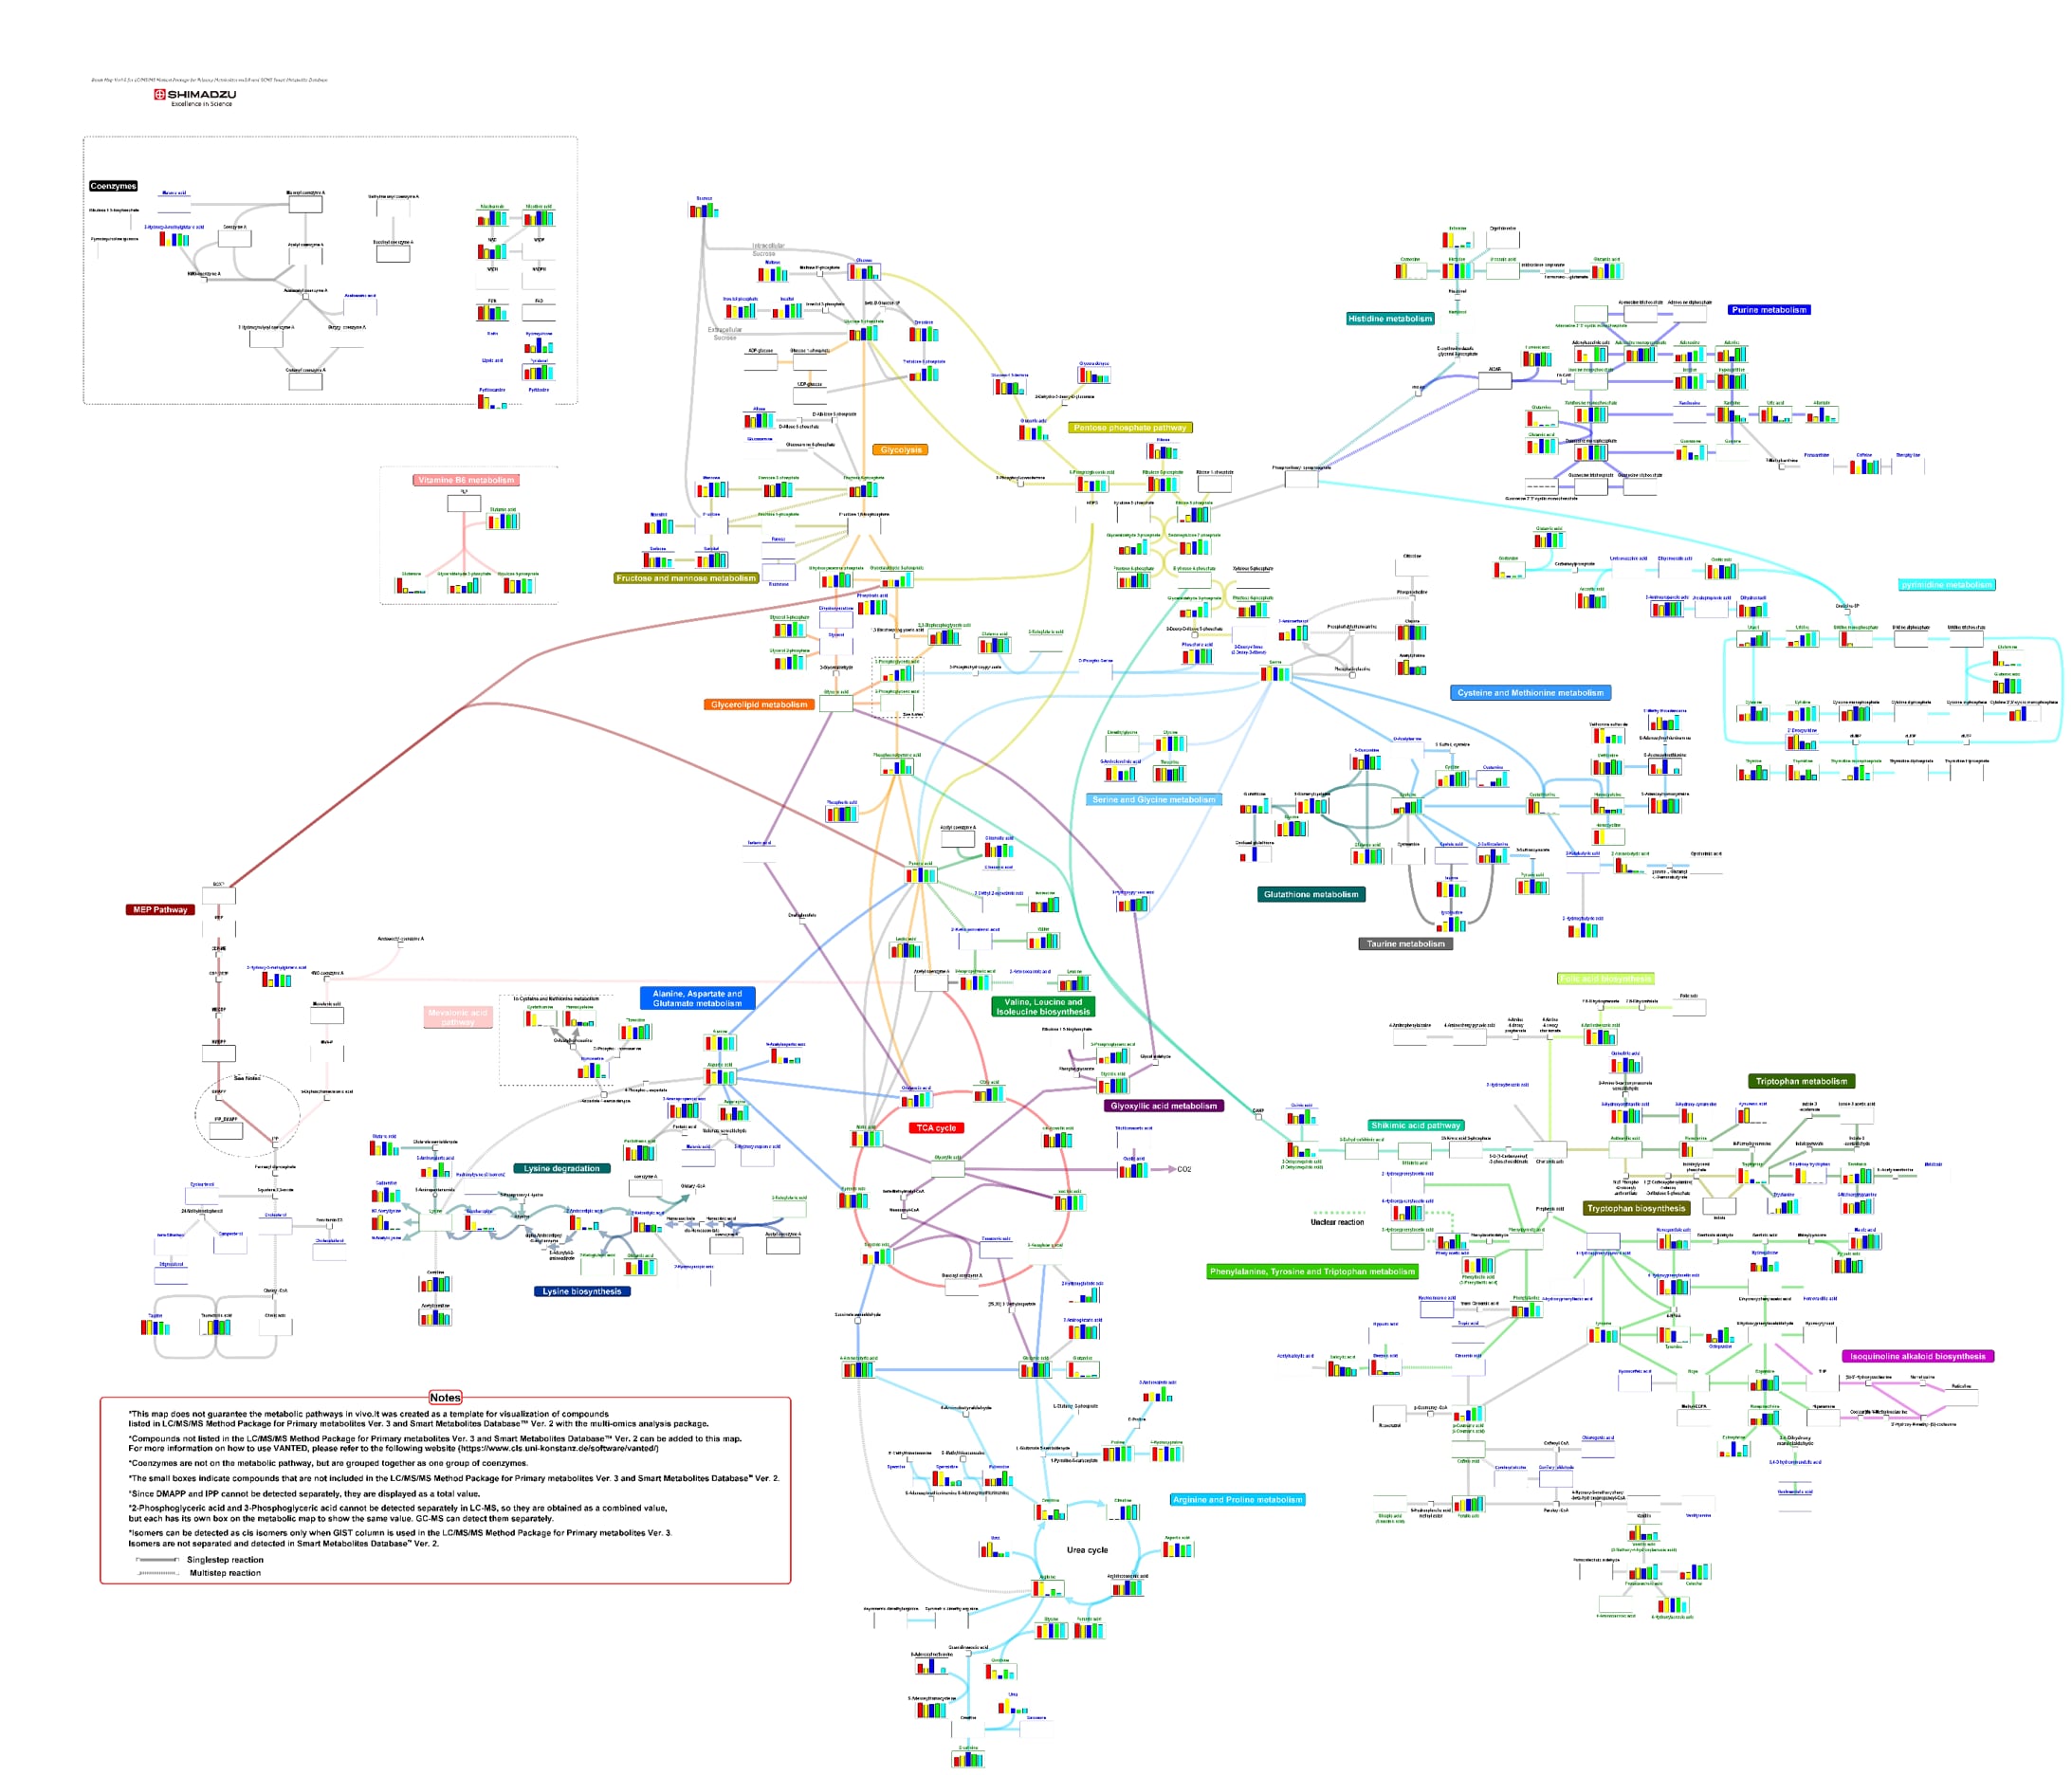
Using the Lipid Mediator Method Package to Display Quantitative Changes in Human Plasma and Serum
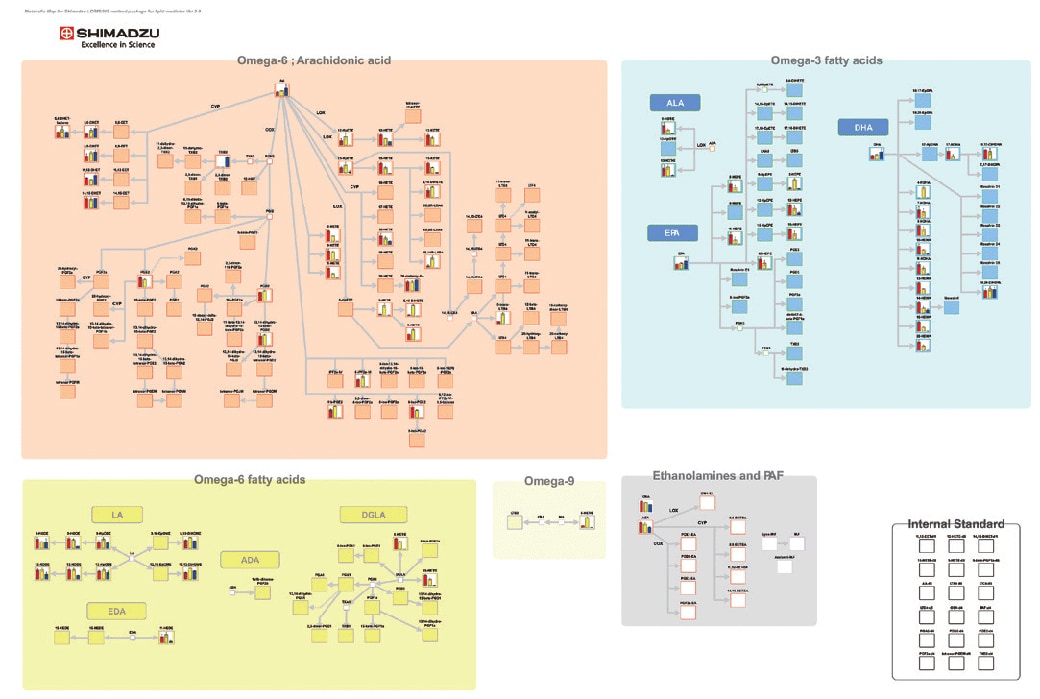
The metabolic map above was developed in cooperation with the Department of Lipidomics at the Faculty of Medicine, The University of Tokyo. For more details, refer to Application News 01-00250.
Using the Cell Culture Profiling Method Package to Display the Time-Course Profile of Metabolites in iPS Cell Culture Supernatant.
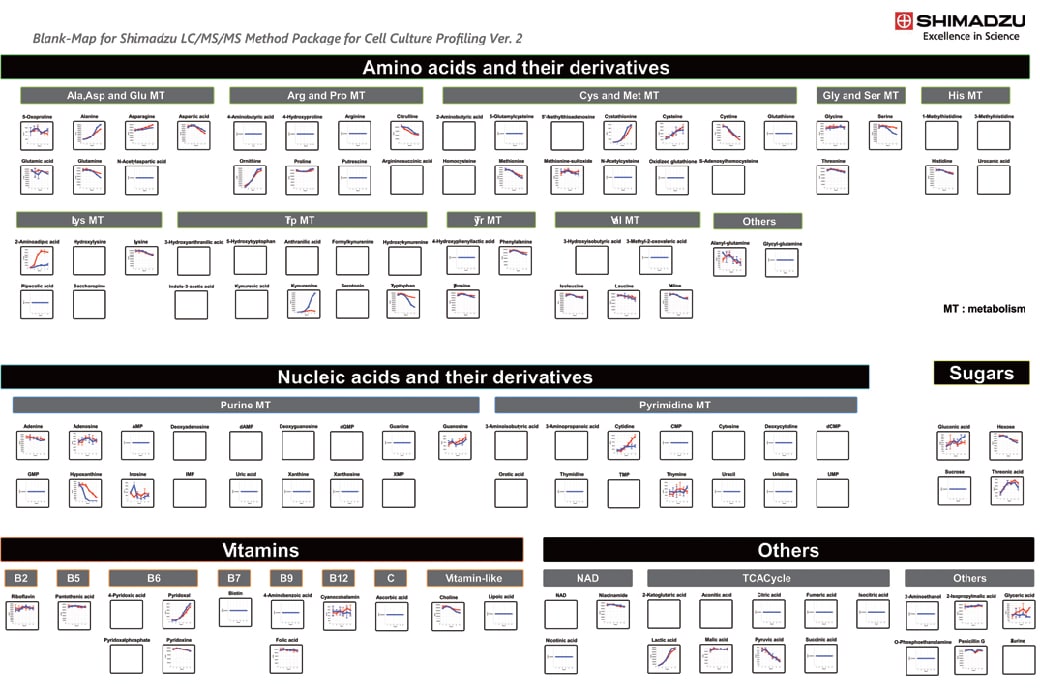
This data was provided by the Research & Development Center for Cell Therapy, Foundation for Biomedical Research and Innovation, Kobe. For more details, refer to Application News C209.
Comprehensive Analysis of Cell-extracts and Culture Supernatants of E. coli and Yeast Using Primary Metabolites Method Package
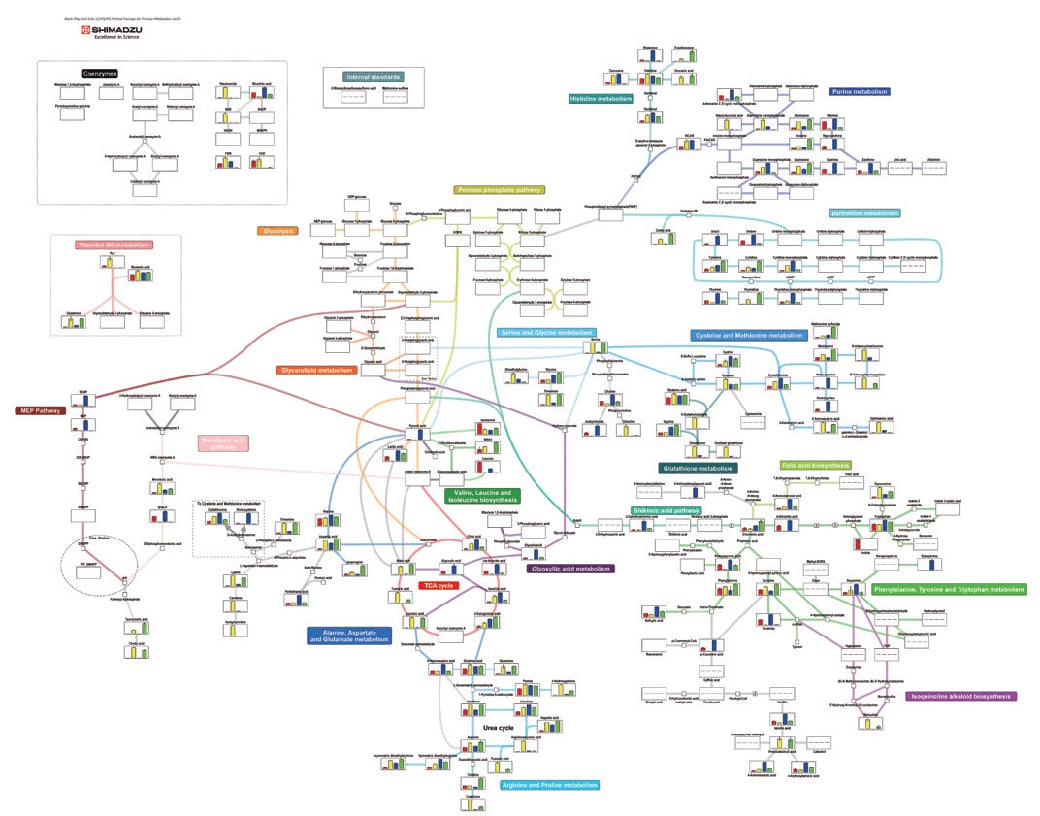
This data was provided by the Engineering Biology Research Center Kobe University.
Using the Bile Acid Method Package to Analyze Human Blood Plasma and Metabolites in Mouse Feces
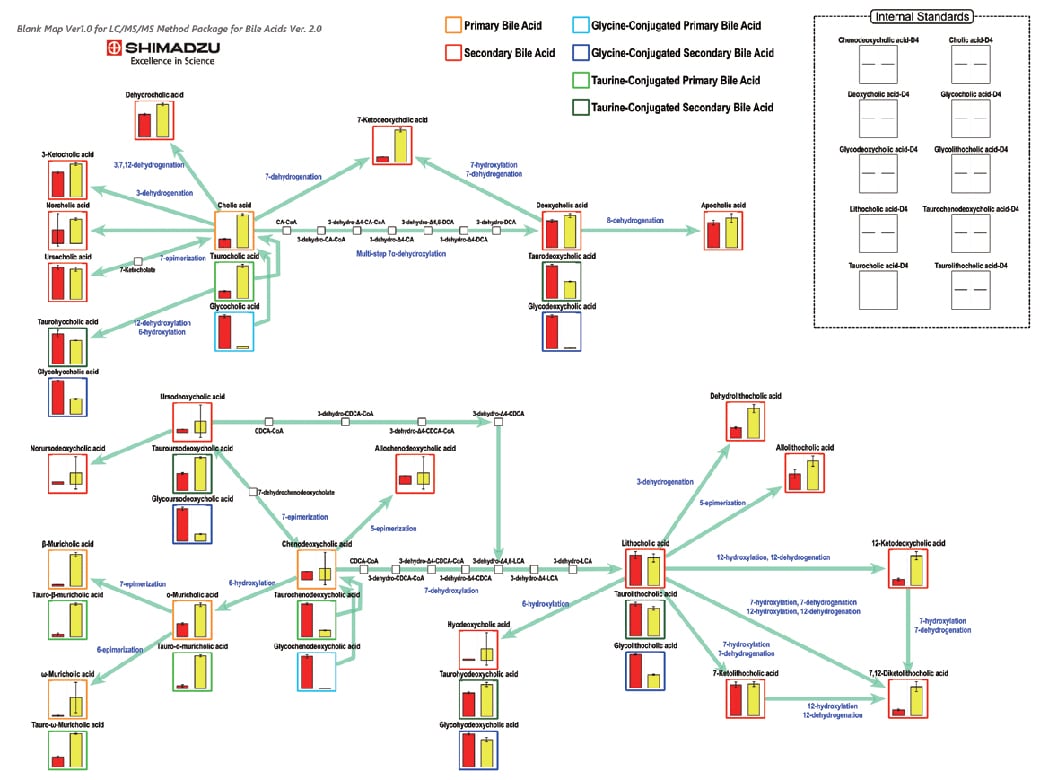
For more details, refer to Application News 01-00196.
Analysis of Metabolomics Differences in Mutant Drosophila Using LC/MS and GC/MS -Integration of LC-MS and GC-MS Data on Metabolic Maps-
For more detail, refer to Application News 01-00410 and 01-00491
Tools for Data Analysis
Tools for Data Analysis
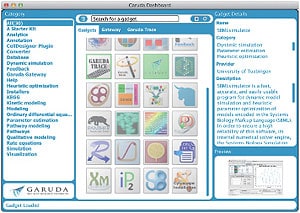
The Multi-omics Analysis Package is based on software tools (called gadgets) that have been released on the GARUDA platform - an open research platform developed by the GARUDA Alliance and led by The Systems Biology Institute, Japan (SBI).
Data Analysis Tools Used in the Multi-omics Analysis Package


Volcano Plot
A tool that combines a t-test (statistically significant difference) and a fold-change (Example: Difference in mean value such as 2 times or 1/2) to visualize the differences between the two groups. The Volcano Plot gadget developed by Shimadzu is included in the package.

EasyStats
This tool is for visualizing principal component analysis (PCA) or hierarchical cluster analysis (HCA) results or box plots (including t-test) of measurement data. It can display metabolite data analysis results in a single window to enable comprehensive determination of characteristic changes.

VANTED
Tool maintained at University of Konstanz, Germany, for visualization and analysis of networks across different data sets. (GARUDA support was developed at Monash University)

Cytoscape
Bioinformatics tool developed by the Cytoscape Consortium, used to visualize metabolic pathways, to integrate gene expression profiles with related data, and so on. It is especially useful for analyzing networks and visualizing correlations.
Corresponding Method Packages and Databases
* The Multi-omics Analysis Package is included with the LC/MS/MS Method Package for Primary Metabolite, Cell Culture Profiling, and Metabolites Method Package Suite.
* There is no blank map for visualization corresponding to short chain fatty acids in the Exact Mass Database for Endogenous Metabolites.