Refractive Index Detection (RID)
Light beams or rays that transmits a substance refract at the boundaries of different substances, such as gas or liquid phases (Fig.1).
Refractive index detection is a detection method that applies the principle of light refraction.
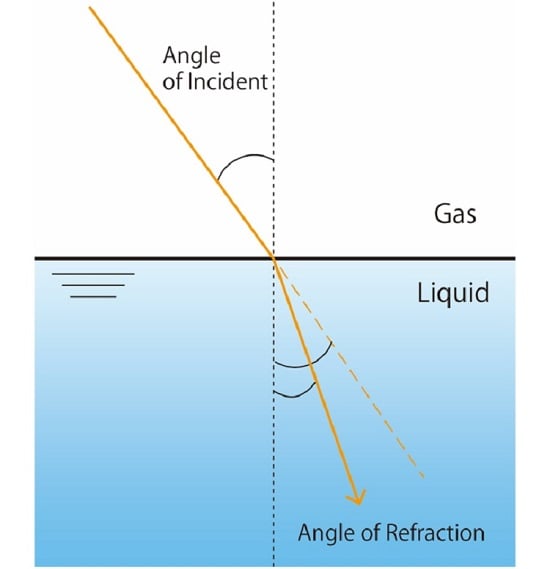
Fig.1 Refraction of Light Beams
Fig.2 shows a schematic diagram of a refractive index detector (RID). The light emitted from the lamp passes through the slit and transmits the flow cell as parallel beam. The transmitted light from the flow cell forms a slit image on the photodiode. The sample side is called the sample cell, through which the mobile phase containing the analyte passes continuously. The reference side is called the reference cell and it is filled with the mobile phase.
When only the mobile phase flows on the sample side, the light ray travels straight without refraction, and both cells are filled with the same mobile phase. When a substance other than the mobile phase, i.e., an analyte, passes through the sample cell, the refractive index of the light changes. Since the light rays do not travel straight but are refracted, the slit image on the photodiode shifts slightly. RID can detect this change of refractive index.
In the analysis with the RID, the sample cell and reference cell must always be filled with the same mobile phase in order to keep a stable baseline. It is essential to select an isocratic elution as the solvent delivery method when using RID as detector.
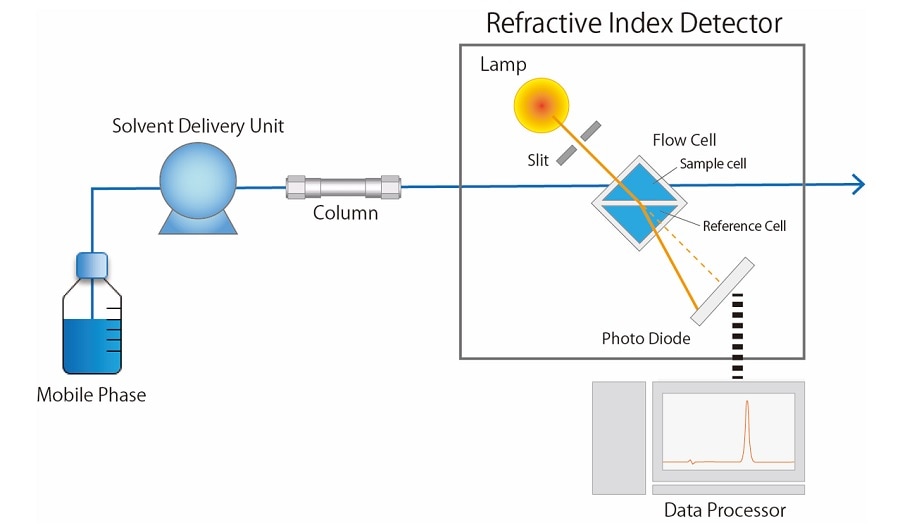
Fig.2 Schematic Diagram of RID
RID is known as “ Universal Detector” because it can detect all compounds that show different refractive index from that of the mobile phase in principle. This method requires sufficient column separation because of the poor selectivity and sensitivity of the compounds that can be detected. Furthermore, it is easily affected by the fluctuation of temperature and the change of pressure from the surroundings. The RID shows small sensitivity difference depending on the target compounds. This feature affords rough abundance proportion of sample components directly so that the RID is commonly used in GPC analysis for calculating molecular weight distribution.
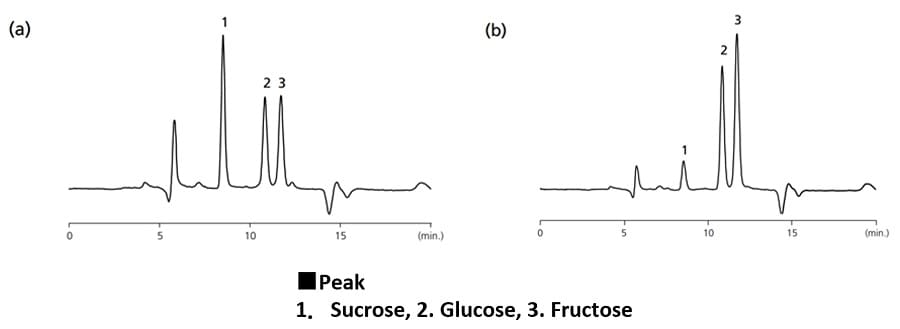
Fig.3 Comparison of Chromatograms in Commercial Orange Juice
(a) 100% Concentrated Orange Juice
(b) Orange Soft Drink
Thus, RID is often used to analyze sugars. Whereas ELSD is used to detect oligosaccharides because they require gradient elution.
Supporting Information