


1.4 Data Obtained from LC-MS
In LC/MS, the data consists of three dimensions: the retention time (from chromatography), the m/z information (from mass spectrometry), and the ion detection intensity. Representing this data in two dimensions, while keeping the intensity on the vertical axis, generates plots with either the retention time or the m/z on the horizontal axis.
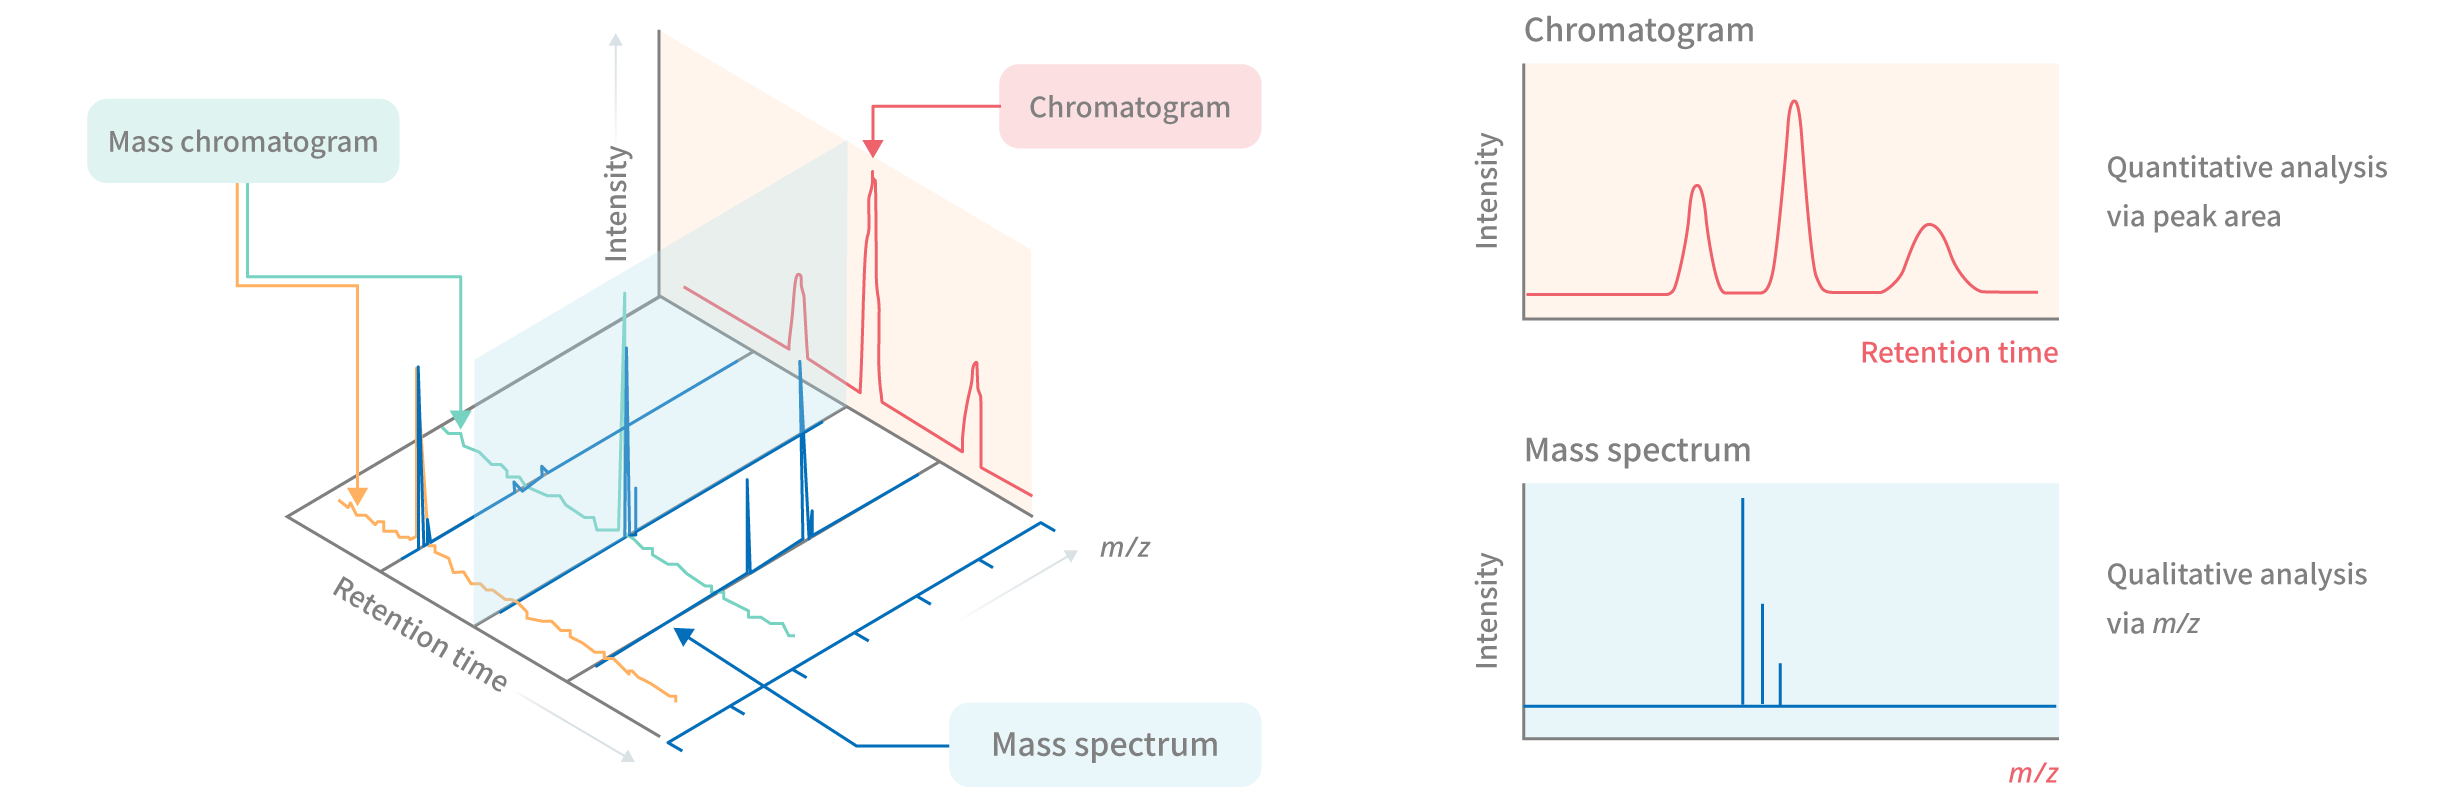
A plot with the retention time on the horizontal axis is called a chromatogram. In mass spectrometry, chromatograms are categorized according to the information plotted. Plotting the sum of the detector responses for all ions within a specific m/z range yields a total ion chromatogram (TIC). In contrast, a plot of the detector response for a specific m/z is referred to as a mass chromatogram or an extracted ion chromatogram (EIC).
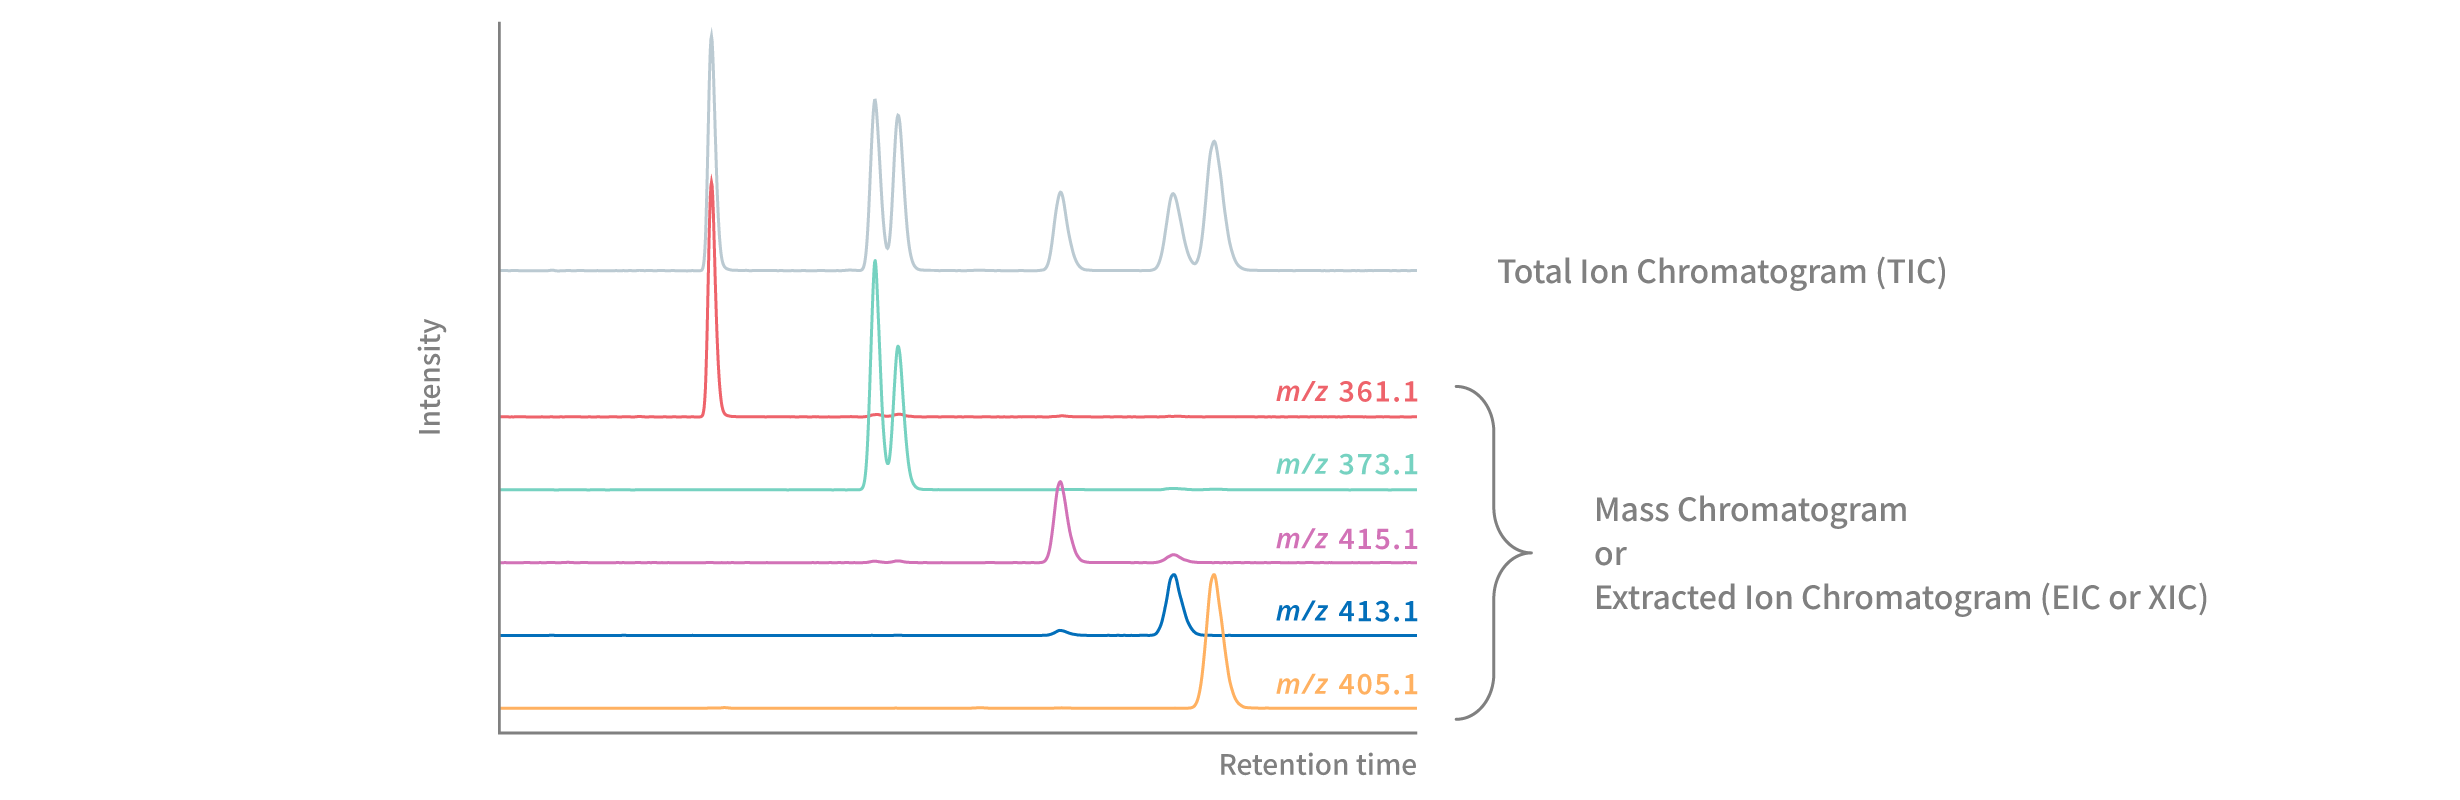
Quantification analysis is performed using the peak area obtained from a mass chromatogram. By analyzing standard samples of varying concentrations and plotting the relationship between the resulting peak area and concentrations, a calibration curve can be constructed. Based on this calibration curve, the concentration of an unknown sample can be calculated from its measured peak area.

A plot with the m/z on the horizontal axis is referred to as a mass spectrum (or m/z spectrum). Because compounds with the same elemental composition yield identical mass spectra, qualitative analysis can be performed by combining the information from both the retention time and the m/z.