Mass Analyzer
Overview of Mass Analyzer
After samples are ionized in a source box, the mass analyzer separates the ions according to their m/z value.
The most common mass spectrometer is the quadrupole (QP) type, which is ideal as a practical and inexpensive instrument because of its compactness, easy operation, easy maintenance, high sensitivity, fast scan rate and moderate vacuum requirement. These points are advantageous to connecting a chromatographic instrument, such as a GC or LC, to a mass spectrometer despite of the limited ability on mass resolution and mass range of the quadrupole mass spectrometer.
Structure of QP Mass Analyzer
A quadrupole mass analyzer consists of four rods, approximately 20 cm in length, aligned in parallel. The main rods are so precisely assembled that working on the main rods, such as reassembling and cleaning, may cause fatal accidents. To protect the main rod from contaminants, which mostly come from the ion source region, the pre-rods are attached to the main rods.
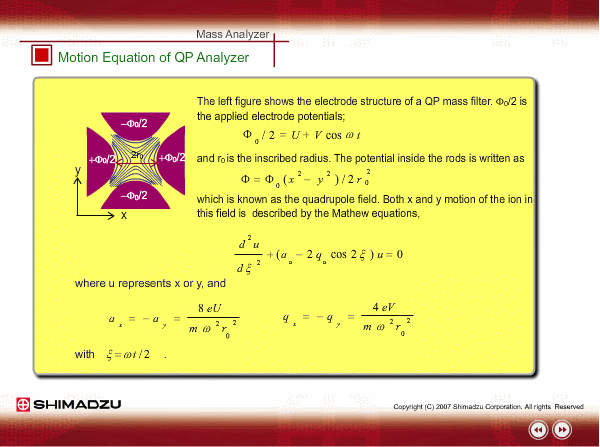
Applied Voltages to Rods
Voltage is applied to each rod
- A RF voltage (V cos (wt)) and a DC voltage (U) are simultaneously applied to the facing rods.
- The RF and DC with the same magnitude but the opposite sign are applied to another pair of rods.
The angular frequency of RF is denoted by w=2pf. The two voltages U and V determine the mass passing through the rods. When U and V voltages are continuously varied with constant U/V, we can obtain the scan data and mass spectrum.
Mass Filtering by QP Analyzer
A QP analyzer filters the ions to pass the specified mass according to the applied voltage.
The figures show the top view and side view of a QP mass analyzer. You have a view of the ion's motion when the voltages are applied to pass the m/z 180 ion. Check the trajectories of ions by entering the m/z numbers into the box, for example m/z=180, 181, 179. You will find that only the m/z 180 ion can reach the exit of the rod, but other m/z ions go off course. Due to this behavior, a QP rod is sometimes called a mass filter.
Stability Region and Ion Trajectory
Check the ion motions of stable and unstable conditions in examples shown below.
Stability Region and Scan Line
The stability diagram can be drawn using a RF voltage axis and a DC voltage axis in place of a and q. For a given mass number m, applying RF voltage V and DC voltage U in the stable region enables the ion to pass through the rod. Usually, for a QP mass filter, V and U are changed, keeping their voltage ratio constant, which is shown in the left figure. This line is called the mass scan line.
Though you set a voltages, not m3, in the range of Dm3, the m3 ion also goes through the rod. The mass resolution can be changed by changing the slope of the scan line and shifting the line upward or downward.