
Gel Permeation Chromatography System
Methods used to measure the molecular weight of polymers include the light scattering method, osmotic pressure method, and viscosity method. These allow obtaining the average molecular weight values. However, many polymers consist of molecules with not just one molecular weight, but rather a collection of molecules with many different molecular weights.
Gel permeation chromatography (GPC) is a type of size exclusion chromatography (SEC). It is mainly used to measure the molecular weight of polymer compounds. The molecular weight distribution shows how much molecular weight contains in a sample, and it is widely used for quality control to know the difference in the properties of polymer compounds.
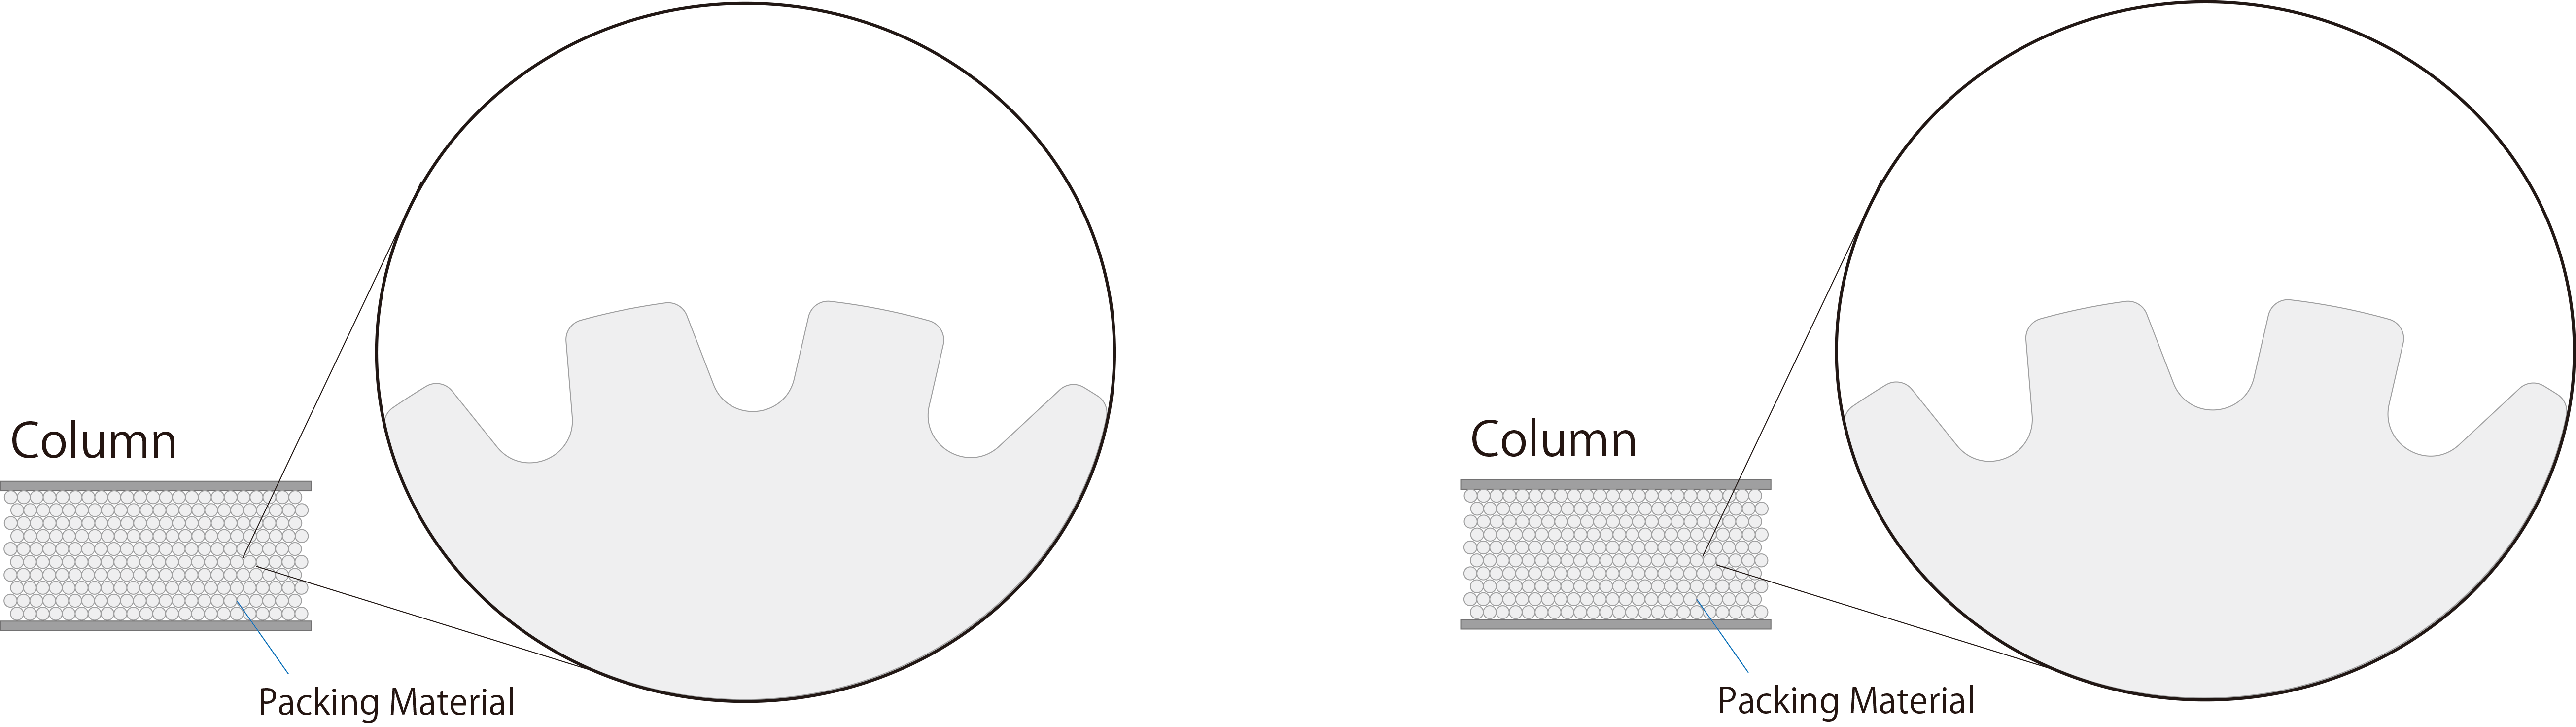
Fig.1 Image of Size Exclusion Chromatography
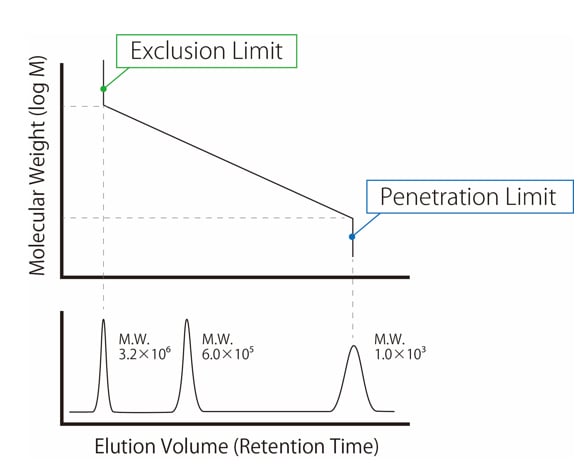
Fig.2 Calibration Curve
Regarding SEC, as molecules of various sizes flow through the column, molecules of small size flow slowly while penetrating deep into the pores in the packing material (Fig. 1, right), while molecules of large size flow out of the column without penetrating the pores (Fig. 1, left). As a result, the elution order from the column is faster for larger molecules and slower for smaller molecules. SEC is a separation mode that sieves molecules according to their size.
In SEC, as shown in Fig.1, the elution order from the column is faster for larger molecules and slower for smaller molecules. The calibration curve shows this relationship graphically. Fig.2 shows the relationship between retention time (also called elution volume) and molecular weight for SEC. When molecules larger than a certain size is separated by size exclusion chromatography, the retention time is the same because the substance passes through the pores of the packing material. This is called the exclusion limit. Conversely, molecules below a certain size completely penetrate the pores and tend to elute almost in the same position. This is called the permeation limit.
In order to obtain an accurate molecular weight distribution of polymer materials, it is necessary to set analytical conditions such that the measured polymer materials are eluted between the exclusion limit and the penetration limit.
In the GPC analysis, the elution amount is determined using a known molecular weight marker, and a calibration curve is prepared by plotting the logarithm of the molecular weight on the vertical axis and the logarithm of the elution amount on the horizontal axis (holding time) before analyzing the unknown sample. Fig. 3 shows the calibration curve prepared using a series of GPC columns (Shim-pack GPC) and polystyrene (PS) as a standard.
Size exclusion chromatography columns are commercially available with a group (series) of different packing material pore sizes (different exclusion limits). For column selection, a column capable of determining the target range of molecular weight distribution should be used. When the molecular weight distribution of a sample is over a wide range, a plurality of columns capable of measuring a certain range of molecular weight distribution are selected from the same product series, and they are connected in series.Alternatively, a mixed gel type column (e.g., GPC -80 M) which contains gel with different pore sizes may be used. The mixed gel type column is mainly used for the analysis of samples of unknown distribution and samples of a wide range of molecular weights in the sample.
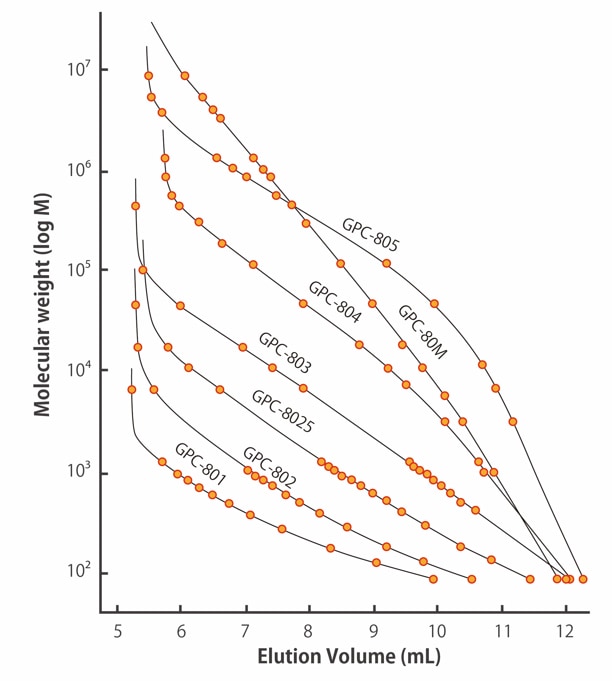
Fig.3 Calibration curves for GPC columns with different target molecular weight regions (Shim-pack GPC Series)
For GPC analysis, the peak shape is not always sharp (Fig.4). A wide peak width means that the molecular weight distribution of the sample is wide, and a narrow peak width means that the molecular weight distribution is narrow. Each peak contains a mixture of high molecular substances with different molecular weights. In other words, the molecular weight of a substance that elutes at an early time even at a single peak is large, while that of a substance that elutes at a later time is small.
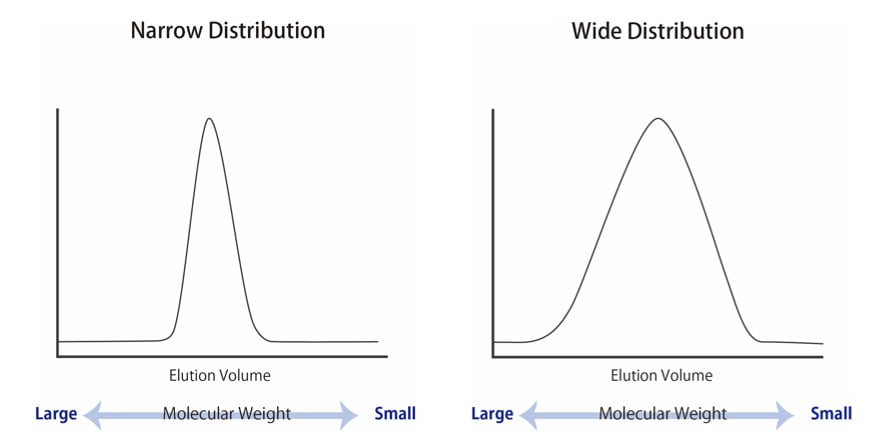
Fig.4 Molecular Weight Distribution
There are several methods for calculating the average molecular weight. As shown in Table 1, physical properties of high molecular substances with the same average molecular weight may differ if the molecular weight distribution is different. These physical properties are evaluated using a testing machine, and the molecular weight distribution obtained by GPC measurement is also considered to be correlated as an index of physical property evaluation.
Table1 Physical properties of various average molecular weights
| Correlating Polymer Properties | Measurement Method (absolute value) | |
|---|---|---|
| Number Average Molecular Weight (Mn) | Tensile strength, impact strength, and hardness | Osmotic pressure and vapor pressure methods |
| Weight Average Molecular Weight (Mw) | Osmotic pressure and vapor pressure methods | Light scattering and ultracentrifuge methods |
| Z-Average Molecular Weight (Mz) | Deflection and rigidity |
GPC for the analysis of hydrophobic polymers has traditionally been conducted using a differential refractive index detector (RID) because many synthetic polymer compounds don’t have the functional groups for UV absorbance and the solvent for GPC mobile phase such as tetrahydrofuran (THF) and N,N-Dimethylformamide (DMF) absorb wavelength.
Fig.5 shows the analytical results of the synthetic polystyrene (PS) obtained using a RID. The average molecular weight of PS was calculated using the calibration curve generated under these analytical conditions. As a result, the weight-average molecular weight (MW) and number-average molecular weight (Mn) were approx. 26,000 and approx. 15,000, respectively.
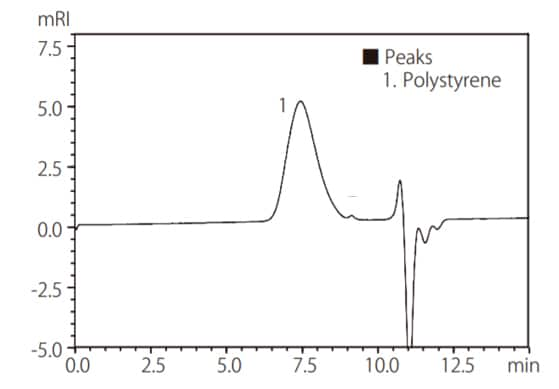
Fig.5 Chromatogram of Synthesized Polystyrene (5 g/L, 5 μL Injected)
Gel Permeation Chromatography System
The GPC software provides the optimal environment for molecular weight distribution calculations, as well as qualitative and quantitative analysis via multiple detectors.
Shim-pack GPC series columns are used for the determination of tetrahydrofuran (800 Series) and dimethylformamide (800D series).