Jewelry, Gemstone
Various instruments are used for the appraisal of precious stones. These instruments are not limited to general gemstone appraisal tools such as the stereoscopic microscope, but also include various analytical instruments. For example, the Fourier transform infrared spectrophotometer (FTIR) is used to determine whether heat treatment/resin impregnated treatment has been applied or not, and to identify both natural or synthetic stones, while the UV-Vis spectrophotometer (UV-Vis) is used to judge whether the stone has undergone coloring treatment or not. The energy dispersive X-ray fluorescence spectroscope (EDXRF) enables the determination of geographical origin and identification of jewelry and gemstones, as well as detect the lead used in lead glass-filling treatment of gemstones via rapid, nondestructive elemental analysis. Rocks and minerals record their initial physical and chemical information when they form, and the information of the metamorphic process that altered the rock after its formation is preserved as the distribution and structure of the rock’s elements. The electron probe microanalyzer (EPMA) is able to determine elements in jewelry and visualize their distribution simultaneously. Revealing the physical and chemical processes of crystal growth and metamorphism of contained minerals enables proper evaluation of precious stones in jewelry and identification of their geographic origin.
Determination of Geographic Origin of Natural Stones
Fig. 1 Results of Qualitative/Quantitative Analysis of Emeralds
The geographic origin is a main factor in the price of emeralds along with other factors such as their transparency, hue, and depth of color (color strength). As distinctive features of the respective geographic origin, Colombian emeralds display a bright green color, while Zambian stones are characterized by high transparency, and the price for Colombian stones is generally higher. Since it is difficult to distinguish deep green Zambia emeralds from Colombian emeralds, elemental analysis is used as a technique for determining the geographic origin. Chromium, iron, and vanadium are elements that give emeralds their color, and the hues of stones change depending on the contents of the respective elements. Emeralds from two different origins were analyzed using the EDX-8100. Fig.1 shows the qualitive and quantitative analysis results. Zambian stone has a high amount of chromium and iron, and a low amount of vanadium in comparison with the Colombian stone. Comparatively large amounts of sodium, magnesium, potassium, and trace amounts of rubidium and cesium were also detected in the Zambian stone, an indicator that helps distinguish this stone from the Colombian stone.
Analysis of Precious Stones by EDX-8100: Differentiation of Natural Stones/Synthetic Stones, Determination of Geographic Origin of Natural Stones
Analysis of Precious Stones by EDX-8100: Differentiation of Natural Stones/Synthetic Stones, Determination of Geographic Origin of Natural Stones
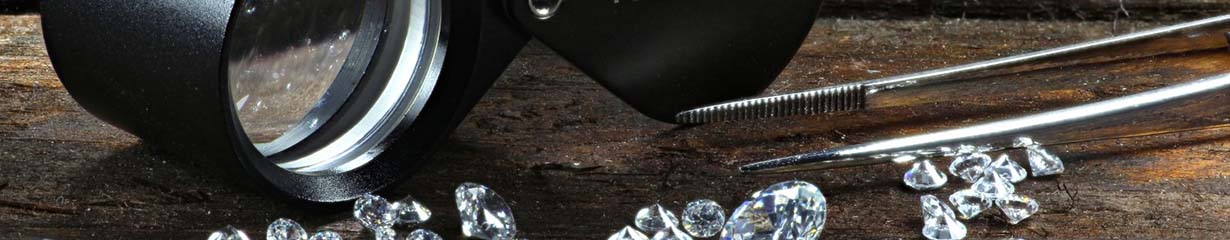
Determining the origin of diamonds (natural or synthetic)
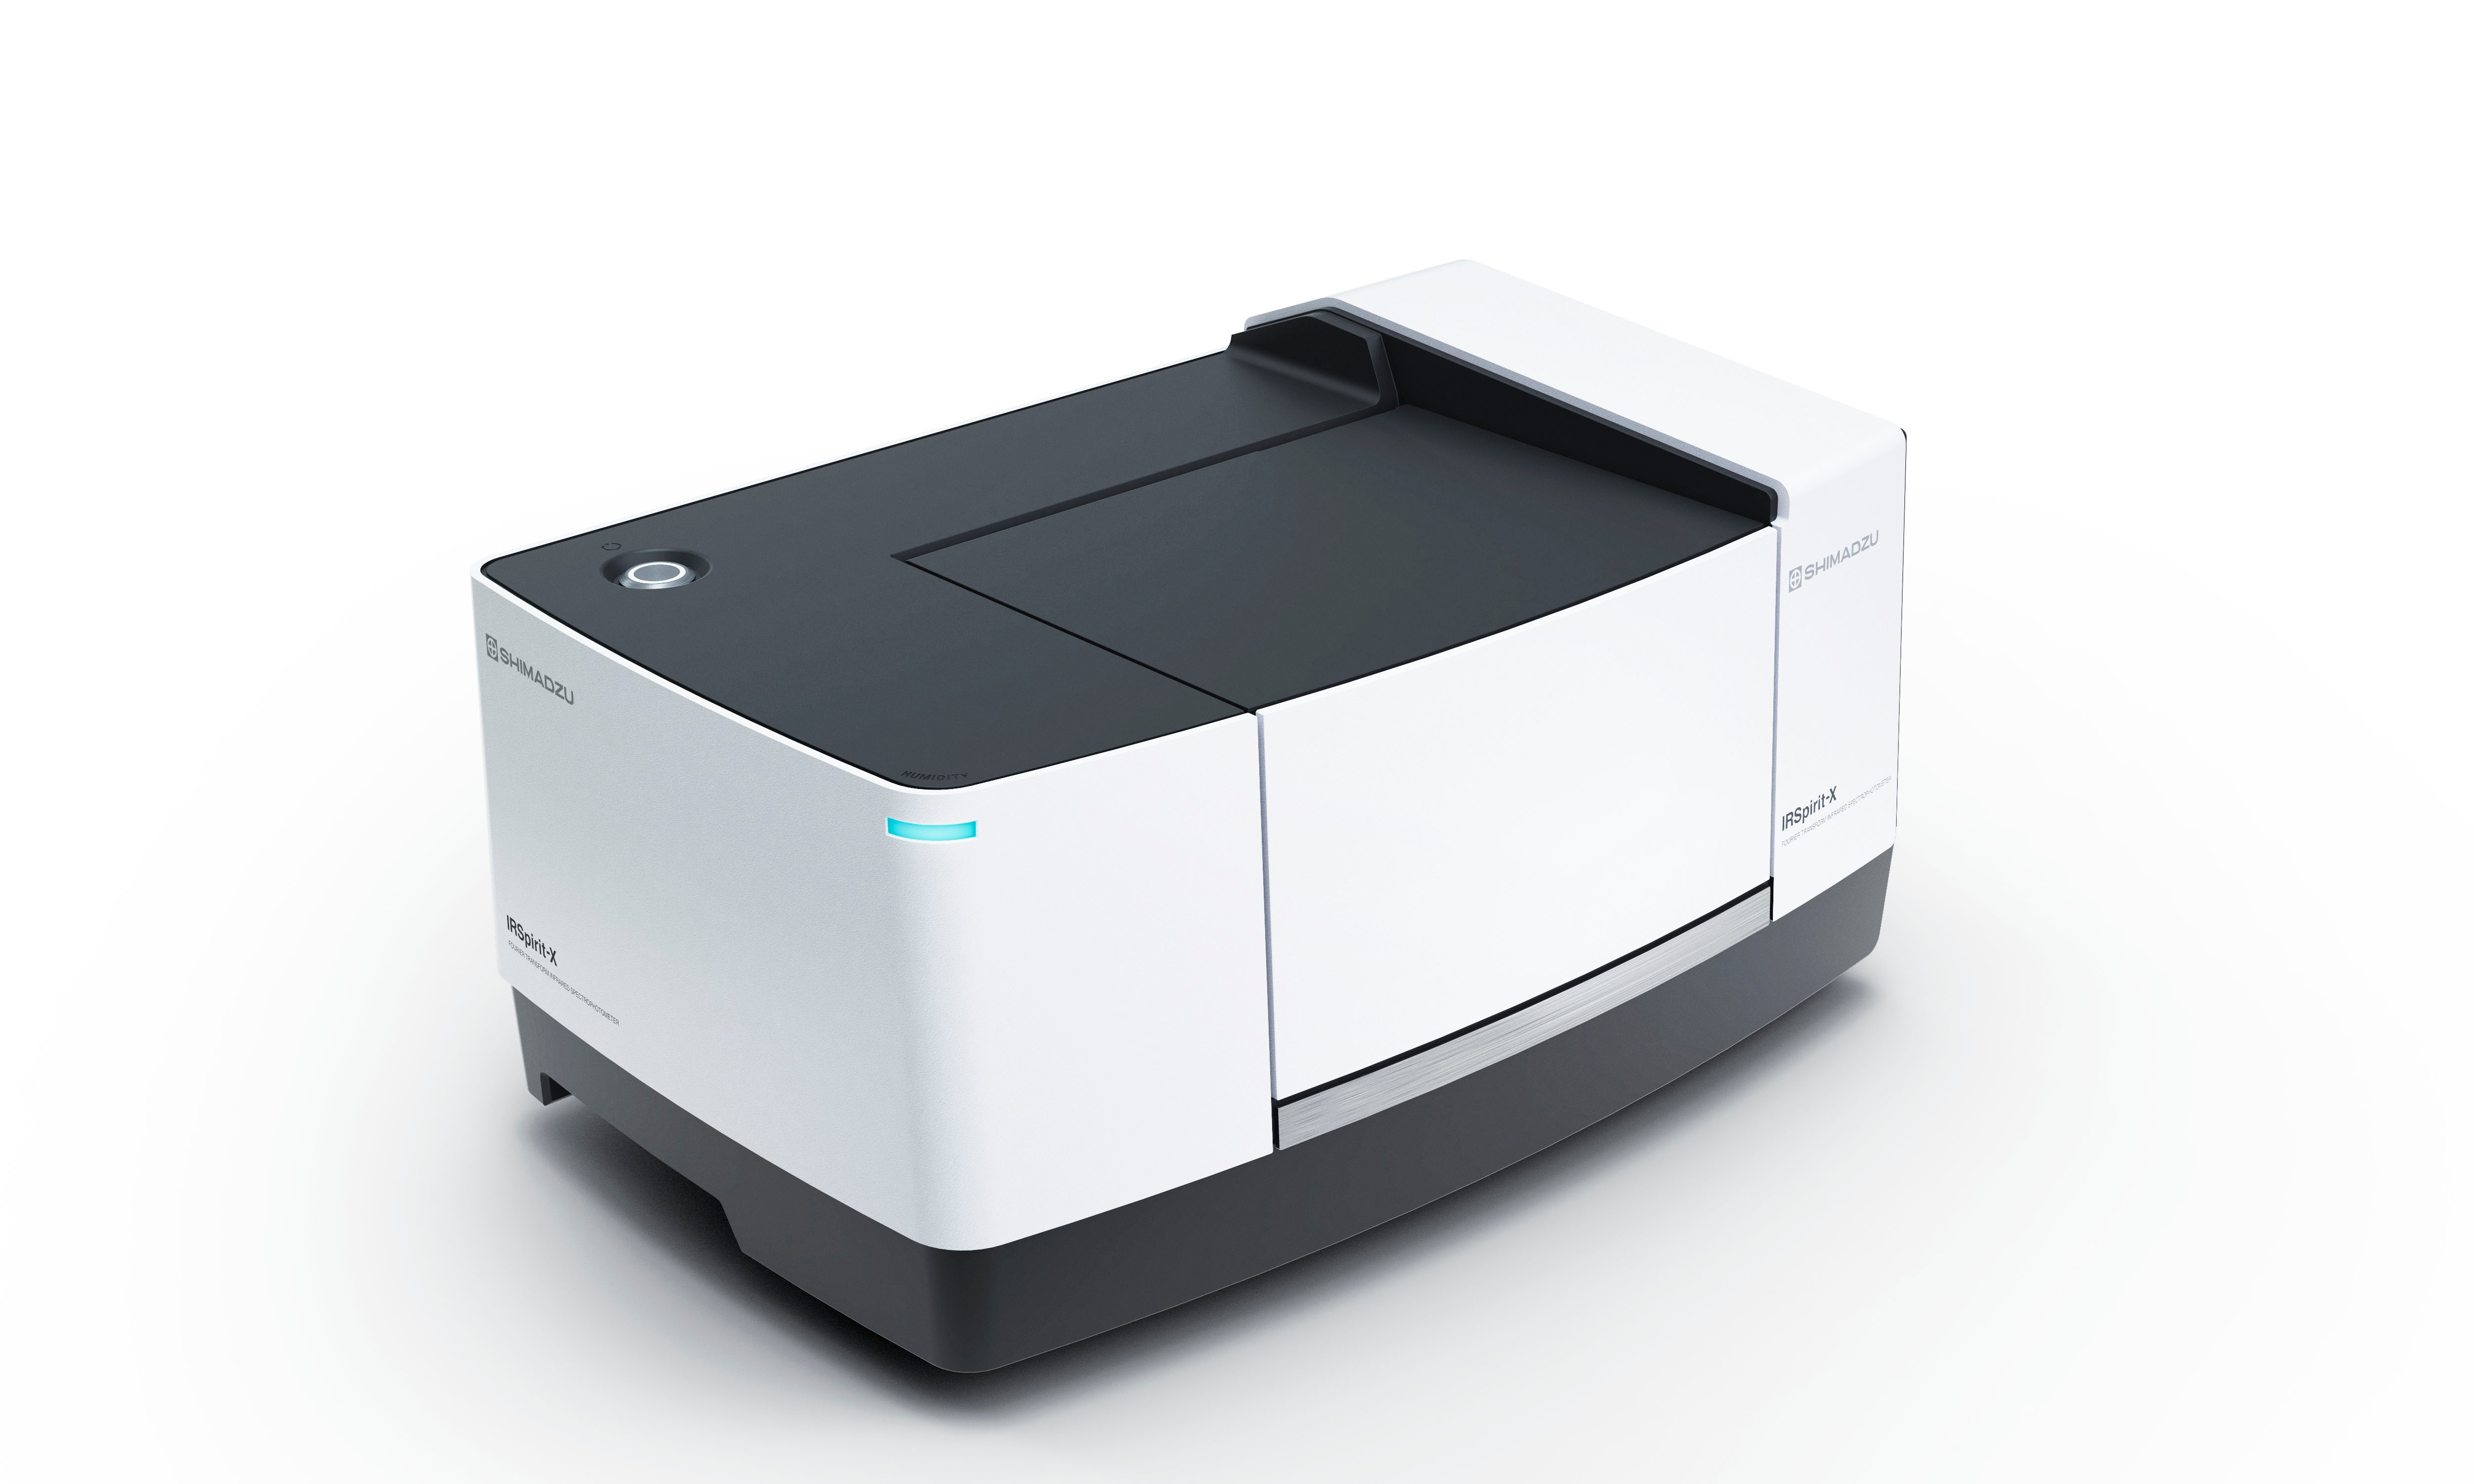
Diamonds, which captivate the eyes of many people, are either natural or synthetic. Natural diamonds are mined from the earth and synthetic diamonds are artificially made. In recent years, it has become extremely difficult to judge whether a diamond is of natural or synthetic origin by using conventional gemstone appraisal tools and equipment, raising the need for new judgment methods. Fig. 2 shows the relative diffuse reflectance measurements of natural and synthetic diamonds using the SolidSpec-3700DUV, an ultraviolet-visible spectrophotometer. The spectrum from diamond A does not have any prominent peaks, but the spectrum from diamond B shows a peak at 415.2 nm. The optical features of diamonds change depending on the amount of impurities (nitrogen molecules) that are present within. The peak at 415.2 nm in Fig. 3 is considered to indicate the N3 center, which comprises of three neighboring nitrogen atoms. Since the N3 center is regarded to be proof of a diamond's natural origin, we can assume that diamond A is a synthetic diamond and diamond B is a natural diamond. The transmittance spectra of a rock crystal and an amethyst were measured using the IRSpirit-X Series, a fourier transform infrared spectrophotometer. Fig.3 shows the obtained spectra. The peak shapes differ between the obtained spectra at about 3400 cm-1. Amethyst, which gains its purple color due to impurities of quartz, has been reported to have a broad and strong characteristic peak at about 3435 cm-1. These spectra show that the presence of quartz impurities can be observed by measuring infrared spectra.
-
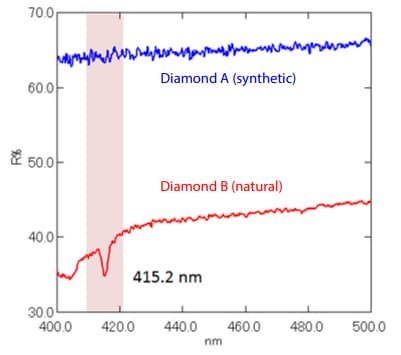
Fig. 2 Reflectance Spectra of Diamonds Blue: Diamond A (Synthetic), Red: Diamond B (Natural)
-
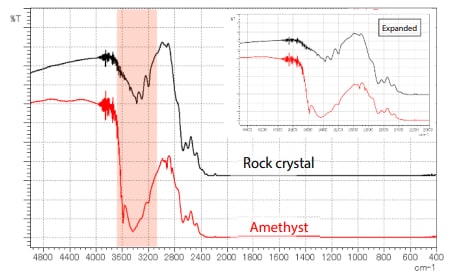
Fig. 3 Infrared Spectra of Quartz Black: Rock Crystal, Red: Amethyst
Evaluating Optical Properties of Diamonds and Natural Gemstones
Evaluating Optical Properties of Diamonds and Natural Gemstones
Elemental Mapping of Epidote
Natural epidote is widely found in metamorphic rocks and metamorphosed at relatively low temperatures, such as greenschist, epidote-amphibolite, and glaucophane schist. Epidote has a chemical composition of Ca2(Al,Fe3+)3Si3O12(OH), while natural epidote takes on a composition between Clinozoisite (Ca2Al3Si3O12(OH)) and Pistacite (Ca2Al2Fe3+Si3O12(OH)) due to the substitution of Al with Fe3+. Elemental mapping analysis of epidote and hornblende in commercially available stones believed to contain epidote was carried out using the EPMA™-1720HT, an electron probe microanalyzer.
Fig. 4 shows the results. The focus of this study was the concentration of Fe and Cr in epidote and hornblende. As shown in Fig. 4(a), the concentration of Fe in epidote was higher at the rim and boundary of the crystals, while the concentration of Cr was higher in areas with less Fe and at the boundary. Furthermore, as shown in Fig. 4(b), Fe distribution in hornblende was found to be almost homogeneous, while Cr was heterogeneous in relatively large crystals with higher concentrations in the center area. However, in some fragmental hornblende, the concentration of Cr was higher at the rim and boundary. It is known that epidote is produced in metamorphic rocks and that the amount of Fe3+ increases with higher metamorphic temperatures, suggesting that the reactions proceeded at the boundary and rim of the crystals during metamorphism. It can also be assumed that hornblende assimilated some Cr-rich substances during metamorphic process or came into contact with Cr-rich components since an abundant amount of Cr was found at the boundary. Elemental mapping of rocks can reveal the physical and chemical processes of crystal growth and metamorphism of contained minerals. Furthermore, the combination of elemental mapping and phase analysis is effective for identifying minerals. With these methods, it is possible to evaluate gemstones and precious stones in jewelry and identify their geographic origin.
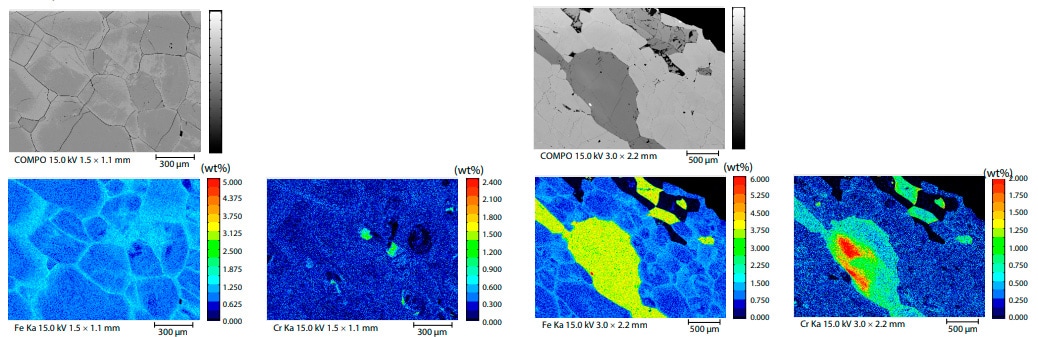
Fig. 4 Detailed Elemental Mapping (a) Epidote, (b) Hornblende
Elemental Mapping of Epidote
Evaluating Optical Properties of Diamonds and Natural Gemstones
Movie