AIMsight™ - Applications
Infrared Microscope

Most of the documents on the LITERATURE is available in PDF format. You will need Adobe Acrobat Reader to open and read PDF documents. If you do not already have Acrobat Reader, you can download it free at the Adobe's Website. Click the GET ADOBE READER icon on the left to download a free copy of Adobe Acrobat Reader.
Electrical and Electronic
Shown here is an example of analyzing a foreign matter adhering to the surface of a button battery. By using the wide-field camera, it is possible to observe entire components and determine measurement points quickly. We performed the analysis using the direct ATR measurement method.
A search of the obtained data using the Shimadzu Original Contaminant Library revealed that the foreign matter consisted mainly of acrylonitrile butadiene rubber (NBR) and contained CaCO3, aluminum silicate (KAOLIN), and phthalates as additives.
Before the measurement, the length of the foreign matter was measured using the length measurement function. As a result, we found that the foreign matter adhering to the button battery surface was 18 μm on the short side and 60 μm on the long side.
-
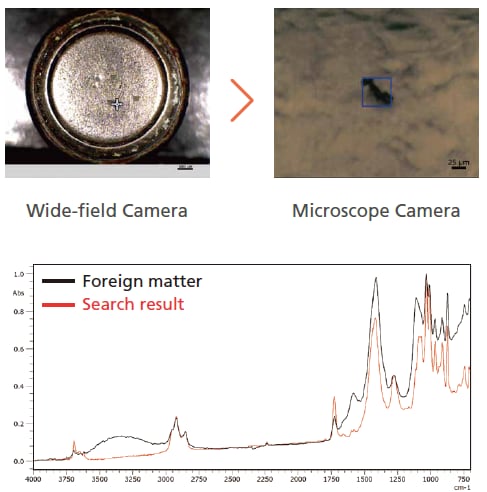
ATR spectra of foreign matter adhering to button battery
surface and comparison of components hit by search -
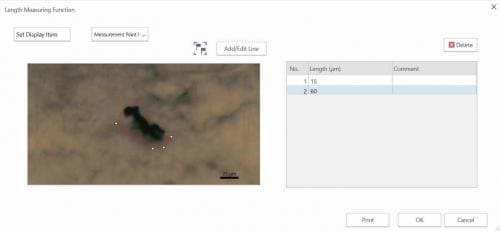
Measurement screen using length measurement function
Machinery and Transportation
This is an example of analyzing resin parts exposed to sunlight for long period. By measuring the infrared spectrum of the component cross-section, the progress degree of the degradation about depth direction from the surface can be visualized.
-
This sample had been exposed to sunlight from the left side
-
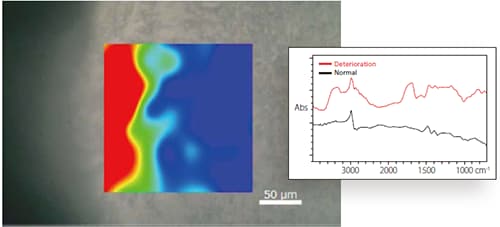
Imaging in the area of the C = O peak indicating oxidation degradation
Pharmaceutical and Life Science
This is an example of the analysis of foreign matter adhering to the surface of a pharmaceutical tablet. By being taken to a diamond cell and rolled, transmission measurement can be performed on various shaped samples.
-
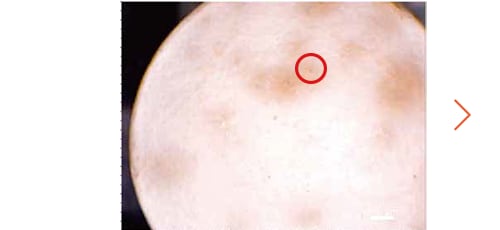
Observation image of the tablet surface approximately 8 mm in diameter with the wide view camera (2× zoom)
-
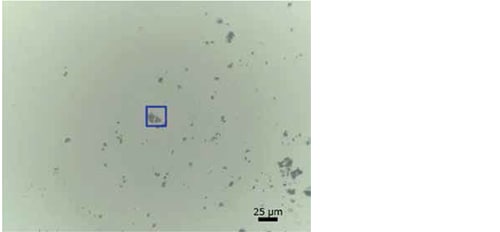
Observation image of the foreign matter on the diamond cell by 15× Cassegrain objective mirror.
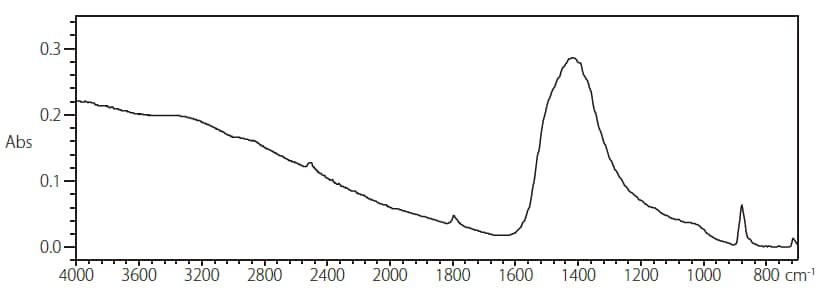
Spectrum of foreign matter collected in the diamond cell. Identified as Carbonat
Material
- This is an analysis example of multilayer film used in potato chip packaging. Sections of the film were cut with a microtome and measured by the transmission method.
We also measured the thickness of each layer using the length measurement function.
From the inside touching the chips, each layer was found to be 27 µm polypropylene (PP), 9 µm PP + polyethylene (PE), 11 µm polyethylene terephthalate (PET), and 42 µm PE.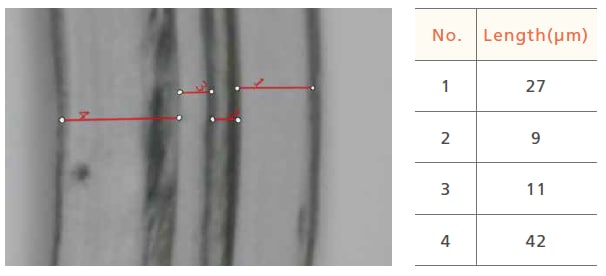
Photographs and length measurement results of the multilayer film
cross sections (inside on the left side of the screen) 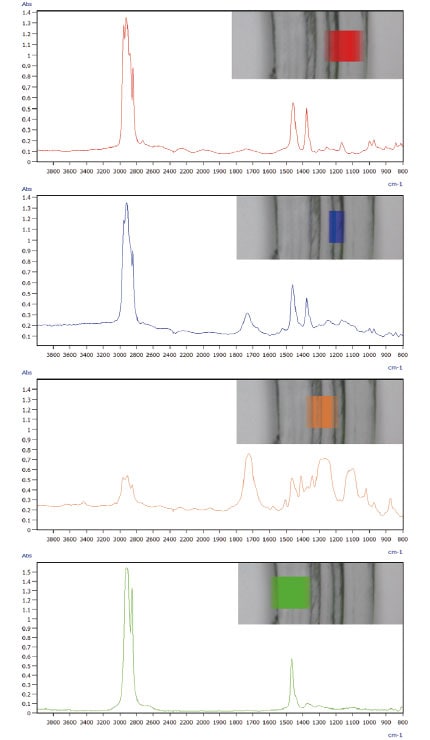
Transmission spectra and chemical image of each layer of the multilayer film
(First, second, third, and fourth layers from the top)
Environment
Shown here is an analysis example of microplastics collected on polytetrafluoroethylene (PTFE) filter paper.
Micro-transmission mapping analysis was performed to determine the material of the microplastics using Shimadzu's original UV-damaged plastic library.
The results showed that the microplastics were polyethylene (PE) and polypropylene (PP). The absorption around 1,200 cm -1 is due to PTFE, the material used for filter paper.
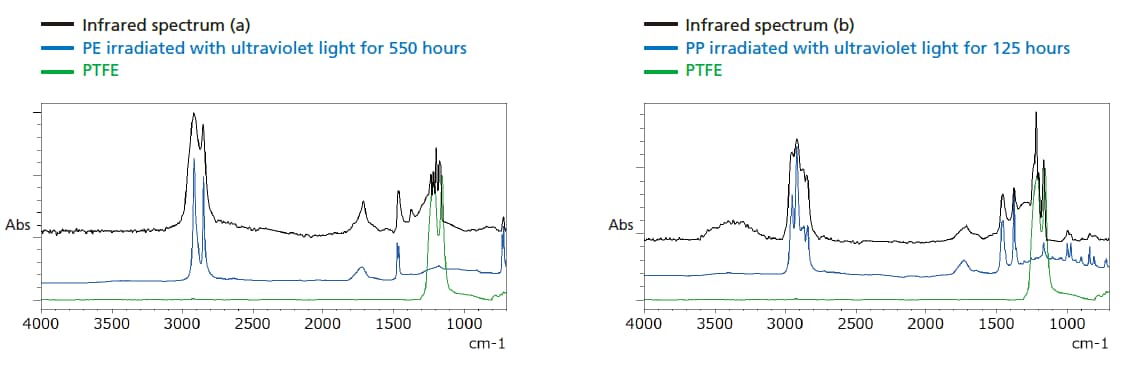
Infrared spectra (a) and (b) extracted from mapping analysis results, and search results
In addition, we performed a mapping analysis of microplastics on filter paper.
For the mapping data, we created chemical images based on the corrected height of the CH2 rolling vibration mode of PE (718 cm-1) and the CH3 symmetric deflection mode of PP (1,373 cm-1).
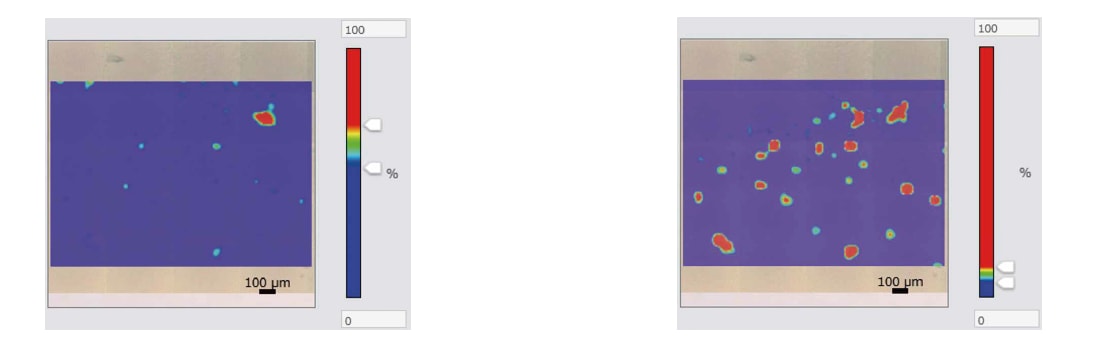
Left: Chemical image of microplastics (PE) on filter paper
Right: Chemical image of microplastics (PP) on filter paper
- Microplastics collected on PTFE filter paper were mostly PP, and it was visually confirmed that PE was present in some of them.
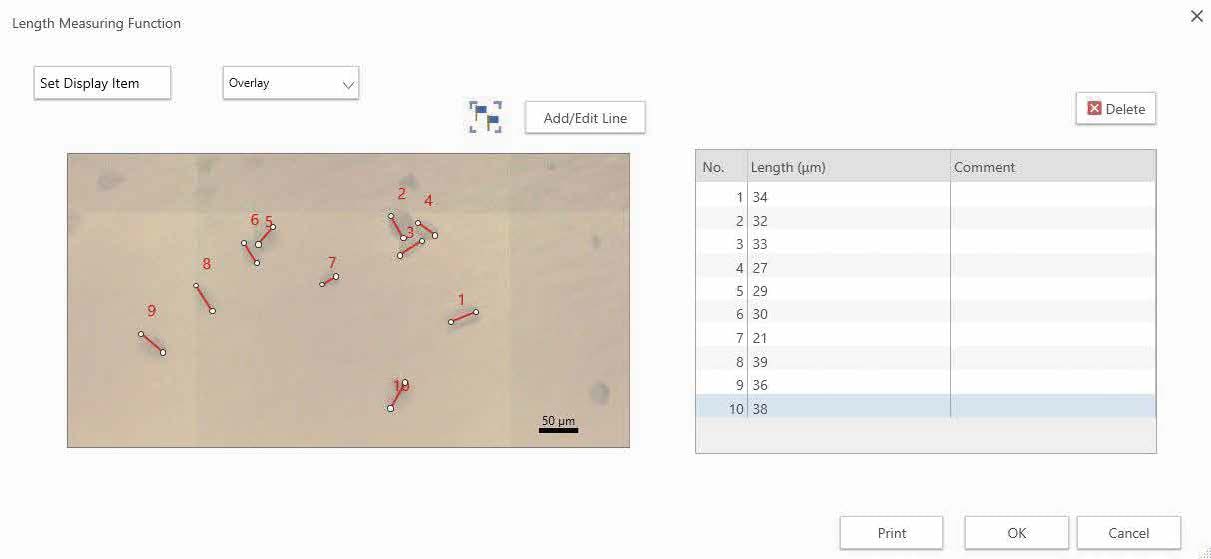
Finally, using the microplastic images measured in this study, we measured the length of several microplastics collected on PTFE filter paper. We found that the filter paper was dotted with multiple plastics of about 20 ~ 40 microns in size.