CellTune Ver.2 - Features
Software for Optimizing Cell Culture Conditions
Analyze Parameters and Interpret Results Without Expert Knowledge
Data Preprocessing and Analysis Automated with Analysis Recipes
CellTune offers “analysis recipes,” which are a series of analysis process steps linked in advance as workflows. Simply executing an analysis recipe allows users to automatically obtain results. For example, a recipe used for pre-processing data links two types of data—experimental conditions and scores, and LC-MS analysis data — using sample ID and elapsed culturing time, and integrates them into a single sheet. Missing data and other values are then supplemented before output.
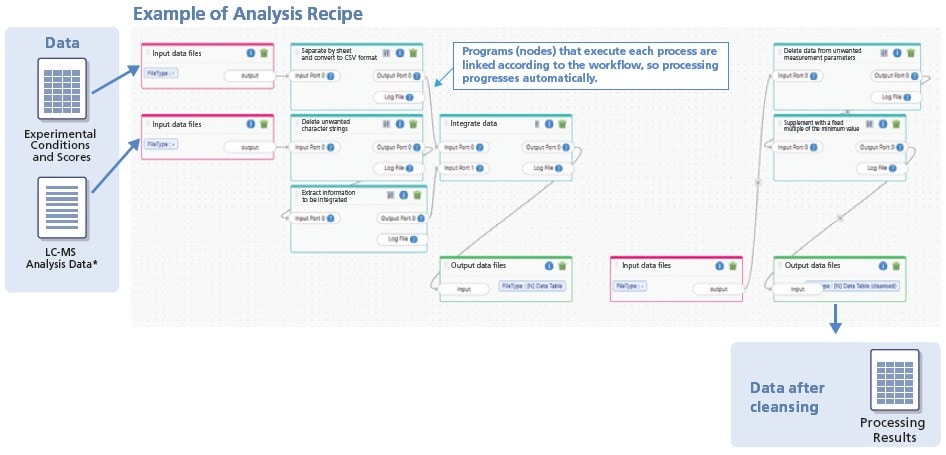
* Data output from LabSolutions Insight
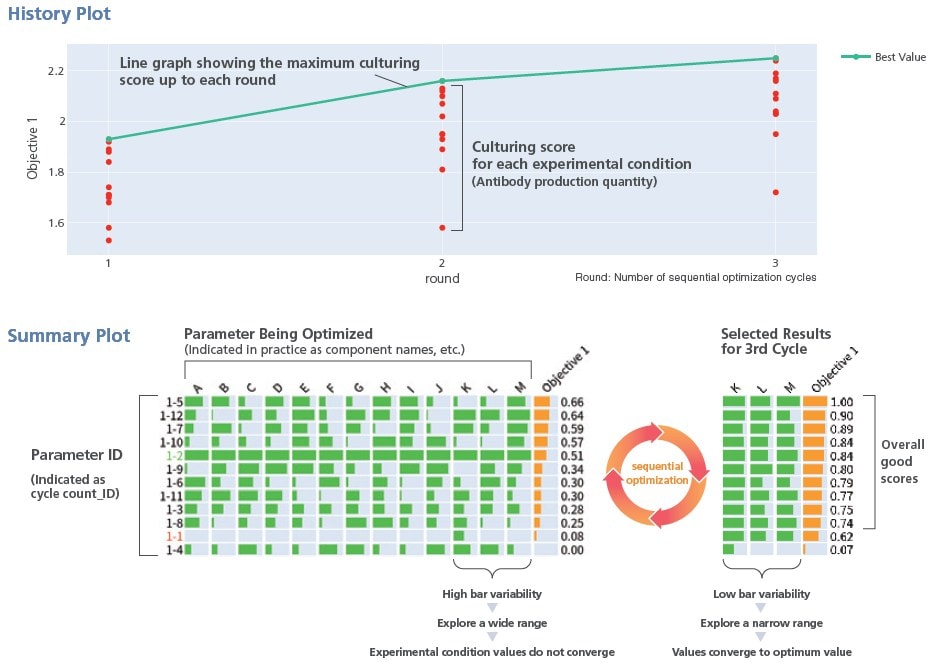
Visualization Functionality Assists Interpreting Analysis Results
This functionality generates graphs that show how far the optimization has progressed and illustrates the importance of the parameters being optimized, making it easier to interpret results.
Advanced AI Algorithms Efficiently Explore Optimal Conditions
Characteristics of Optimization Using AI
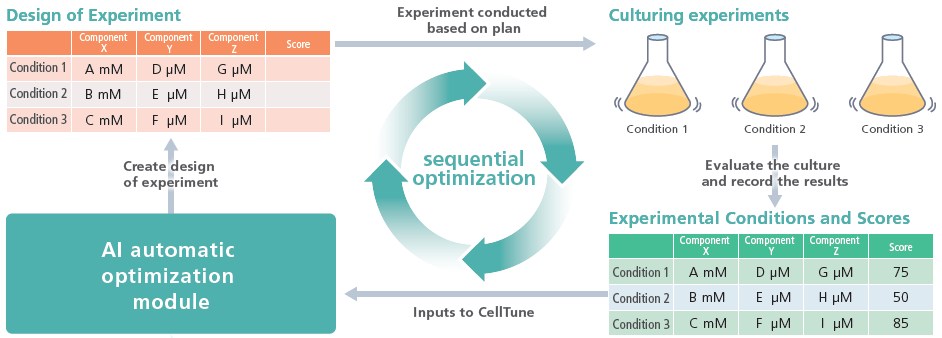
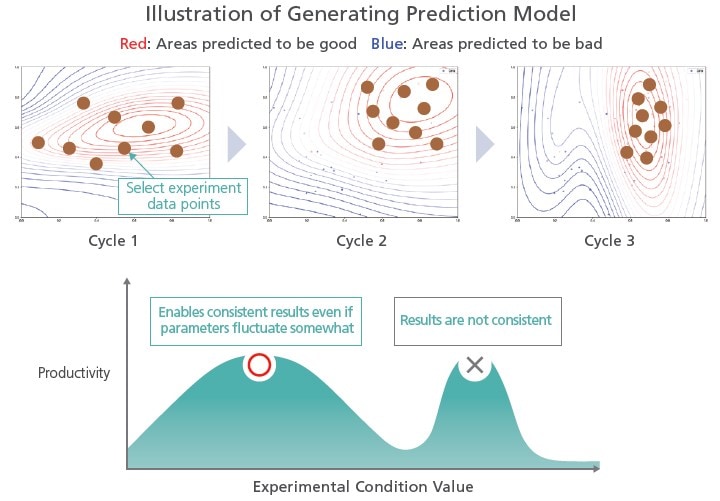
Create Design of Experiment Generating Experimental Designs by Selectively Choosing Experimental Points in Promising Prediction Areas
Conduct culturing experiments and evaluations based on the design of experiment output. By entering the experimental conditions and scores into CellTune and updating the data with the AI automatic optimization module, the next experimental design is automatically generated. That cycle (sequential optimization) is then executed repeatedly.
-
Selective Selection of Promising Culturing Conditions
A score prediction model is generated inside the AI automatic optimization module based on the experimental conditions and scores.
Then, a user-specified number of experimental data points are selected near the areas where good scores are expected and a design of experiment is output.Improved Prediction Accuracy with Each Iteration of Sequential Optimization
As the sequential optimization process is repeated, the prediction model becomes increasingly refined, which enables increasingly accurate predictions.
Proposes Experimental Conditions Robust to Variations in the Experiment Environment
It prioritizes proposing experimental conditions that achieve consistent culturing results even if parameters change.
-
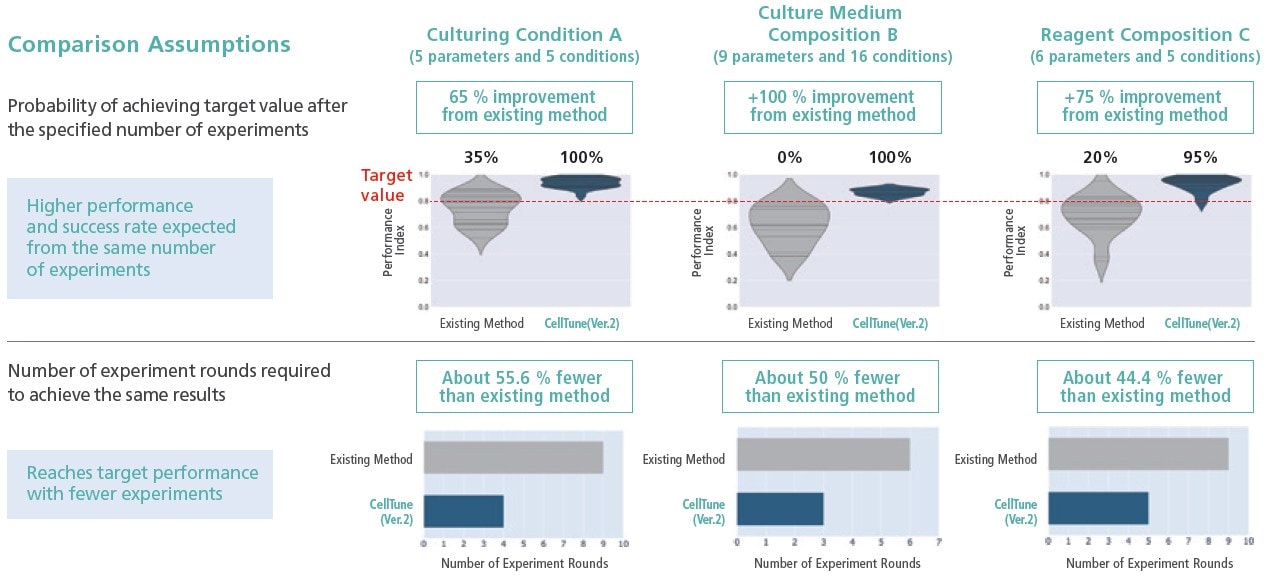
Performance of AI Included
CellTune is equipped with an advanced AI algorithm that enables more efficient optimization compared with existing methods, including available open-source Bayesian optimization algorithms.
Various Auxiliary Functionality Enables Optimization by Customers
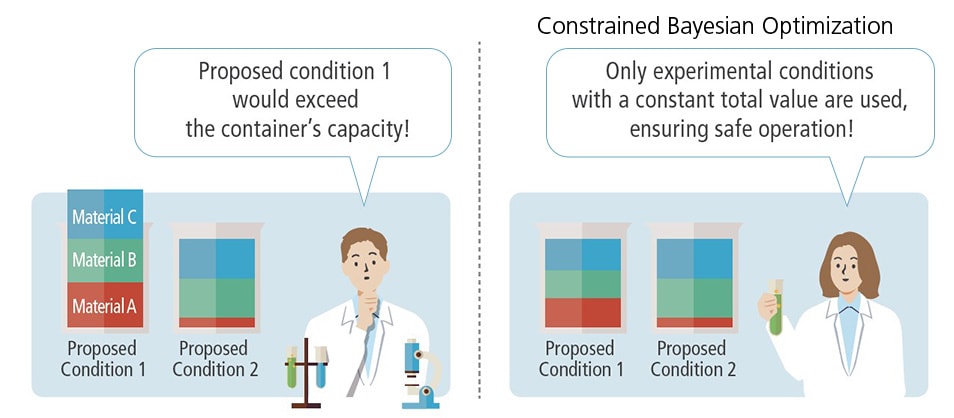
Constrained Bayesian Optimization
-
Parameters can be optimized with constraints specified for those parameters. For example, settings can be optimized while keeping the total parameter value equal to 100. In addition, the parameter step size (the amount parameters can be changed per step) can be specified.
Optimization Estimation Function
-
This function can simulate the difficulty level of a specific optimization, based on factors such as the number of parameters optimized and the number of conditions included per design of experiment, and graph the simulation results.
Consequently, it can determine whether the optimization being attempted will be overly difficult or roughly estimate the upper bound of achievable results within the available resources. 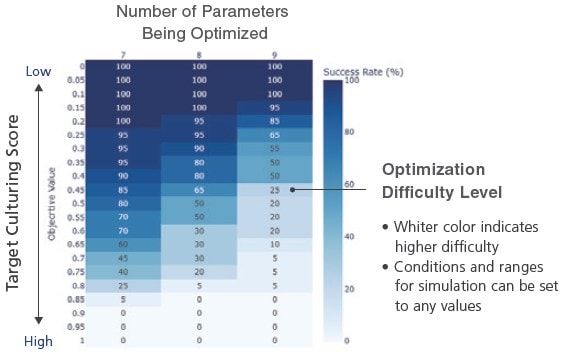
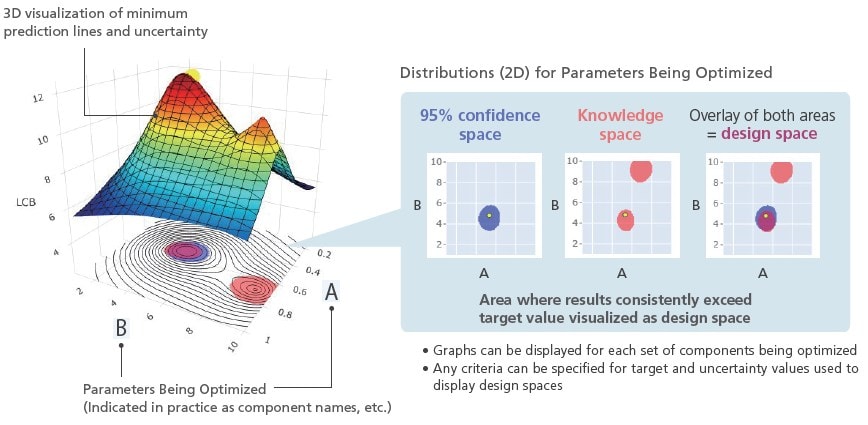
Condition Range Visualization Function
-
When optimal conditions are determined, a design space can be used to show how much variations in each parameter affect culturing results. This allows users to visualize the ranges that can consistently satisfy the target score threshold, even if experimental conditions fluctuate.