LabSolutions UV-Vis - Features
Analytical Data System for UV-Vis Spectrophotometers
Simple - Easy to use for everyone
Simple Design
From the start, the software's user-friendliness allows users to perform operations with ease.
With extensive features, LabSolutions UV-Vis meets a wide range of users' expectations.

Measurement
Measurement functions are grouped on the instrument control panel. The instrument and accessories can all be controlled from here.

Graph

For the horizontal axis of the spectral graph, select the wavelength, wave number, or energy.
-
Wavelength

-
Wavenumber

-
Energy

Smart - Improve operational efficiency
Automatic Spectral Evaluation (Spectral Evaluation Function)
By specifying various evaluation criteria for measurement results, spectra judgments can be made automatically. In the report creation window, reports can either be prepared based on a previously specified report format or freely laid out based on various parameters, data, or other elements.

Up to 40 evaluation items selected from more than 100 items (including optional items) can be performed at once.
In this example, the photometric value, peak wavelength, and peak count are configured as evaluation items. A sample only passes the general judgment if it passes all of the respective individual judgments. If a sample fails, the row is highlighted in red, so the pass/fail status of the samples can be seen at a glance.
-
Case 1: Validation Test in Drug Development

1. Peak exists in the 270 to 280 nm range.
2. Only one peak exists in the 260 to 300 nm range.
3. The peak intensity is > 0.45 Abs.
4. Peak does not exist in the range > 320 nm. -
Case 2: Quality Inspection of UV Cut Filter

1. The first wavelength is < 550 nm when transmittance exceeds 50%.
2. Minimum transmittance above 550 nm is > 80.0 %.
3. Average transmittance above 550 nm is > 85.0 %.
4. Maximum transmittance below 400 nm is < 1.0 %.
Assist Function 
The instrument assists the user to ensure that measurements are performed using the correct procedure.*1
 Checks whether or not baseline correction, auto zero correction or cell blank correction*2 has been performed and informs the user if it has not been.
 Informs the user if the last correction performed is not appropriate for the planned measurement.
 Informs the user if the UV-1900i Plus is not ready to begin measurement and when starting measurements and 100 %T (0 Abs) corrections.
*1 This function can be enabled/disabled.
*2 This function is applied to baseline corrections, auto zero corrections, and cell blank corrections.
Shutdown/Wakeup Functions

The instrument can be shut down and put into sleep mode. Putting the instrument into sleep mode limits power consumption and helps preserve the lamp. After a long period of measurements, the instrument and software can automatically be shut down. After shutdown, the instrument can also be set to wake up automatically at a specified time. With this function, analysis can start the instant the user arrives at the laboratory.

Seamless - Automate repetitive tasks
Analysis Automation
Smoothing and peak detection can be performed automatically after the spectrum is measured.


Automated Reporting
The report is printed automatically after the spectrum is measured.

Easy Transfer of Measurement Data
The waveform being measured can be transferred in real time to Excel™. (Microsoft Excel™ must be purchased separately.)
The data is transferred to Excel™ as the graph is plotted. Transfer is completed when the measurements are complete.

- Multiple waveforms can be output
in matrix format to a single text file.
- The spectral data and the time series data can be output
as text files as soon as the measurements are complete.
Automatic control functionality is used by LabSolutions UV-Vis to successively perform operations automatically in order of the assigned commands, without an operator having to click buttons or enter characters in software windows with a mouse or keyboard. Using this functionality enables automated system analysis, permits execution of specific operations, such as start/stop operations that do not require an operator performing the operations in a window, and can achieve a system that prevents human errors.
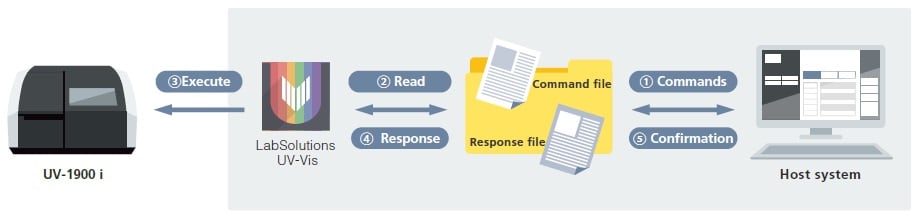
Commands are text files that can be used to configure specialized systems. By placing simple text files that contain a list of commands in a folder, LabSolutions UV-Vis automatically reads the commands contained in the file, loads the parameter settings file, performs baseline corrections, measures the spectrum, or performs other processes automatically.