MultiNA II MCE-301, Microchip Electrophoresis System for DNA/RNA Analysis - Features
Microchip Electrophoresis System
Simple and Smart Workflow
Designed with the user in mind, MultiNA II enables efficient, reliable analysis using simple operations. The intuitive software provides clear-cut procedures for automatic analysis, significantly increasing laboratory productivity.
STEP 1 Reliability
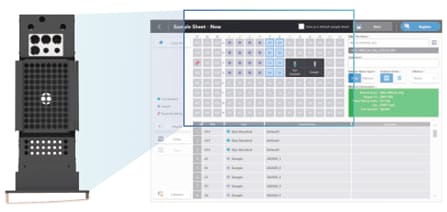
Register analysis schedule
Because sample racks can be removed from the instrument for handling, samples can be registered while making sure they are handled properly. The software allows the analysis sequence to be selected using intuitive operations. It even allows schedules to be saved, imported, and exported.

STEP 2 Operating Efficiency
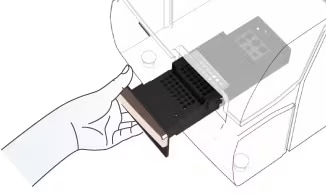
Place samples and reagents
Simply place the samples and reagents in the tray, insert the tray into the system, and start the analysis.
STEP 3 Operating Efficiency
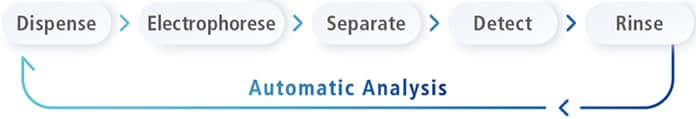
Click the start button
All steps from dispensing samples to rinsing the microchip are performed automatically by the system. Data is displayed successively, starting with the sample currently being analyzed, so results can be checked immediately.
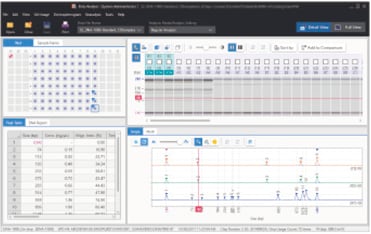
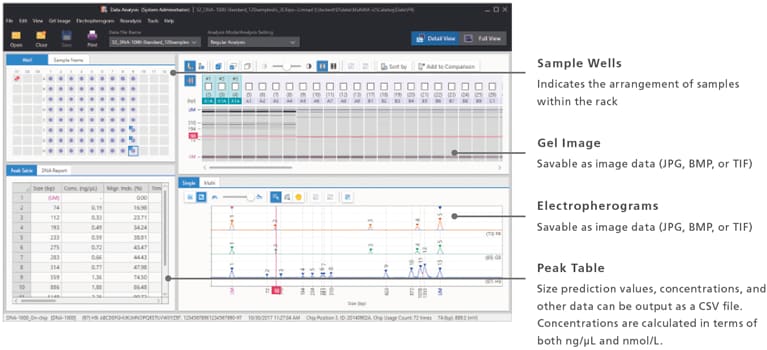
Checking Analysis Results Convenience
Intuitive data analysis software enables instant confirmation of target information of interest.
Novel Functionality Achieves a New Workflow
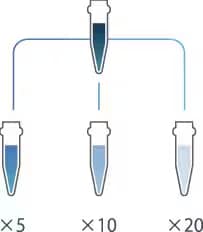
Automated Sample Dilution
Samples can be diluted with purified water to ensure the concentration is within the quantitatable concentration range. The system can automatically dilute samples to the specified concentration level (5, 10, or 20-fold dilution)*1.
*1 Dilution functionality is supported for up to 48 samples. Tubes for dispensing diluted samples are required separately.
Adding Samples During Analysis
The system can be paused during an analysis to allow adding up to 120 samples. This is particularly useful when analyzing samples from multiple users because there is no need for the analyst to prepare all the samples at the same time or wait until the current analysis is finished.
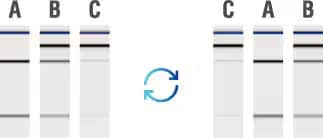
Changing the Order of Gel Images
Gel images can be rearranged into any order, regardless of the actual sample analysis order.

Comparison/Analysis of Past Data
Past data can be displayed next to current data for comparison. Even data acquired using a previous model (MCE-202 MultiNA) can be loaded and analyzed*2.
*2 Data analysis is not supported for some reagent kits.
Operating Efficiency
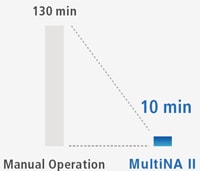
Automatic Analysis Significantly Shortens Analysis Time
Analysis can be started after 10 minutes of preparation. Fully automatic analysis significantly shortens operating time. In addition, the system enables overnight analysis, which provides time for focusing on research or business processes.
Reliability
Calibration Curves Used for Automatic Prediction
Predicted sizes and concentrations are calculated automatically to provide numerically objective results. Each analysis is corrected using an internal standard reagent to provide reliable data.

Convenience
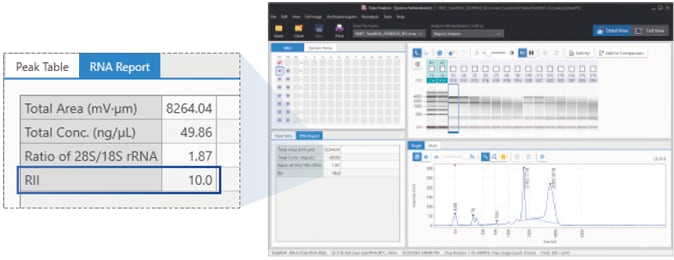
Convenience of Using Data
Dedicated data analysis software is equipped with a variety of functionality to support data processing based on specific applications.
Enhanced Analysis Functions
RNA
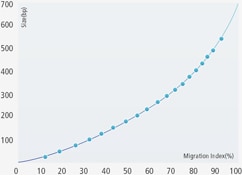
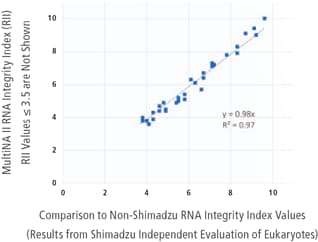
RNA Integrity Index (RII)
Extracted RNA continues to decompose as time elapses. MultiNA systems can calculate RII values as an independent method of evaluation. The correlation to integrity index values calculated by non-Shimadzu systems has a 0.95 or higher coefficient of determination value.
-
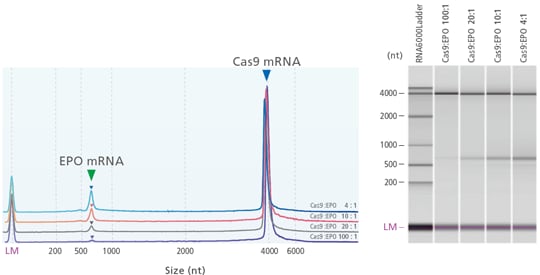
mRNA Analysis: Used for Purity Analysis
Cas9 mRNA (4522 nt) and EPO mRNA (859 nt) mixtures prepared to 4:1, 10:1, 20:1, and 100:1 concentration ratios were analyzed using the MultiNA. The EPO mRNA was clearly detectable for all ratios.
-
DNA
DNA Fingerprinting Analysis
For analysis with a positive control, the presence/absence of each DNA fragment in samples can be determined automatically. After analysis, results can be collectively listed or shown grouped with other samples of the same type.
-
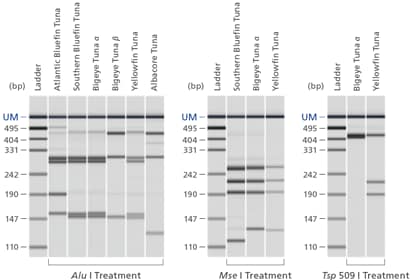
Tuna PCR-RFLP Patterns
-
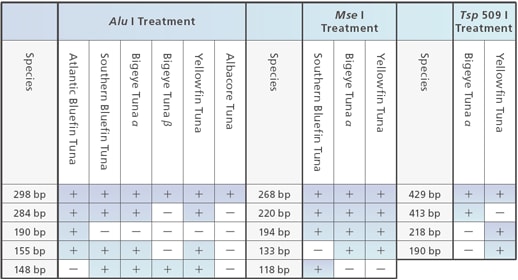
Tuna Discrimination Patterns
User-Friendly Design
Intuitive Software
In addition to rearranging gel images, it is easy to display size prediction values as size guides (red lines) within gel images or electropherograms.
-
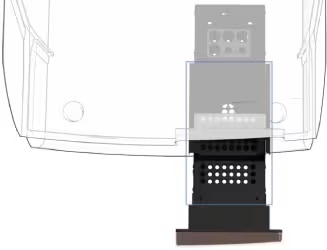
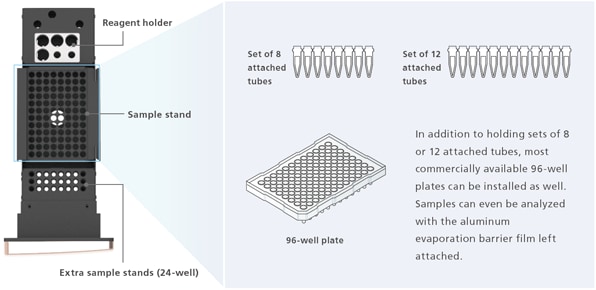
Removable Sample Rack
This removable rack holds up to 96 plates. Up to 2 types of reagent kits can be loaded in a mixed arrangement.
-
Expandable Application Range
Genome Editing
Functionality for grouping analysis and molar concentration ratio analysis enables powerful support for screening genome-edited samples.
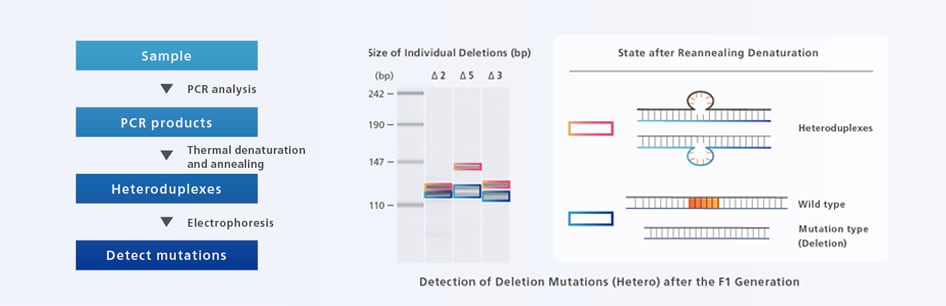
Detection of Deletion Mutations Induced by Genome Editing Tools
The availability of genome editing tools has enabled genetic modification of biological organisms. Consequently, research activity involving genome editing has expanded rapidly. Heteroduplex mobility assaying is a quick, easy, and inexpensive method for evaluating the introduction of mutations. Since electrophoresis of heteroduplex DNA tends to involve slower mobility, it can be used to determine the presence/absence of mutations and the genotype.。
-
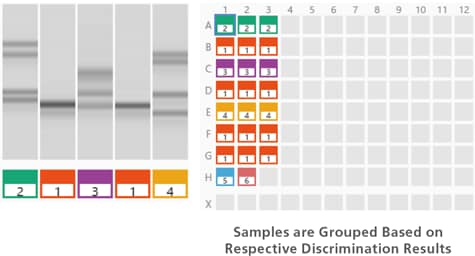
Grouping Analysis

Correlation coefficient values are calculated from heteroduplex mobility assay results for each sample and then samples with the same mutation type are grouped. Consequently, discrimination between homo and hetero types and between mutation types, which had been accomplished visually, can now be detected automatically and displayed as a single list.
-
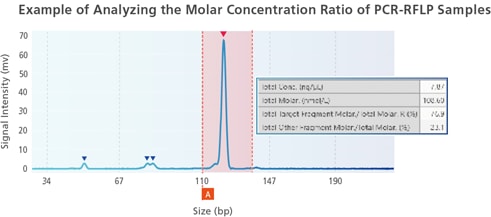
Molar Concentration Ratio Analysis
By specifying the target size range, the molar concentration ratio of peaks (bands) within that size range can be calculated. The mutation activity of the designed genome editing tool can be quantitatively evaluated by analyzing HMA, Cel-I assay, PCR-RFLP, and other data.
Analytical Intelligence is a new concept for analytical devices offered by Shimadzu. It ensures systems and software are operated just like an experienced expert would, by automatically determining whether the system status and results are acceptable or not and by providing feedback to users and resolving problems. It also ensures data reliability by compensating for any differences between user instrument knowledge or experience levels.
NGS
With the high-sensitivity kit, smear analysis functionality, and RNA integr
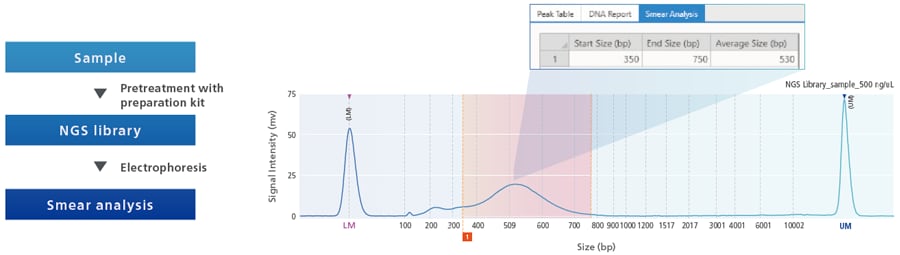
NGS Library Quality Control
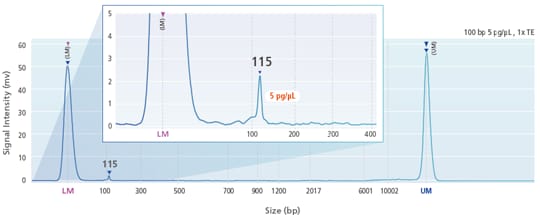
In order to obtain good results from next-generation sequencers (NGS), the distribution and concentration of sizes in the NGS library must be properly understood. The smear analysis functionality can be used to calculate the average size and concentration values. Used in combination with a high-sensitivity kit, library data can be evaluated for concentrations down to 5 pg/µL.
-
High-Sensitivity Kit
Used in combination with a high-sensitivity kit, library data can be evaluated for low concentrations.
-
Genotyping
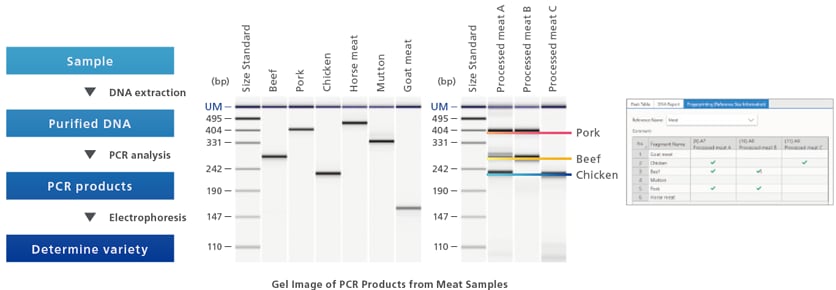
DNA fingerprinting functionality makes it easy to identify genotypes.
Determining the Type of Meat Products
If it is difficult to identify the type of meat based on its appearance and texture, then it can be helpful to determine the type genetically. For example, depending on the freshness and processing status of meat, it may be difficult to identify the type of meat, but by using PCR analysis in combination with restriction enzyme treatment, the type of meat can be determined with high accuracy.
ECO Functions, Energy Savings
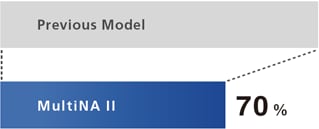
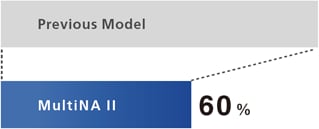
MultiNA II models achieve 30 % lower power consumption than previous models. In addition, the size is 27 % shorter than previous models, making it suitable even for confined laboratory spaces. Finally, it consumes over 40 % less purified water for rinsing, which helps reduce the volume of liquid waste and its environmental impact.
Comparison of Power Consumption by MultiNA II and Previous Model
Energy Savings Achieved
Power consumption was reduced to 70 % of the previous model. That not only reduces running costs during analysis, but also contributes to achieving a carbon-free society by reducing CO2 emissions.
Purified Water Consumption by MultiNA II Compared to Previous Model
Water Savings
The purified water consumption for rinsing was reduced to less than 60 % of the previous model, which helps reduce the volume of liquid waste and its environmental impact.
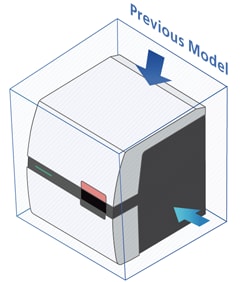
Requires Less Space
The MultiNA II has a 15 % smaller footprint and is 27 % shorter than the previous model (with the front door open). That makes it easier to install and requires less laboratory space.