IMAGEREVEAL MS - Features
Mass Spectrometry Imaging Data Analysis Software
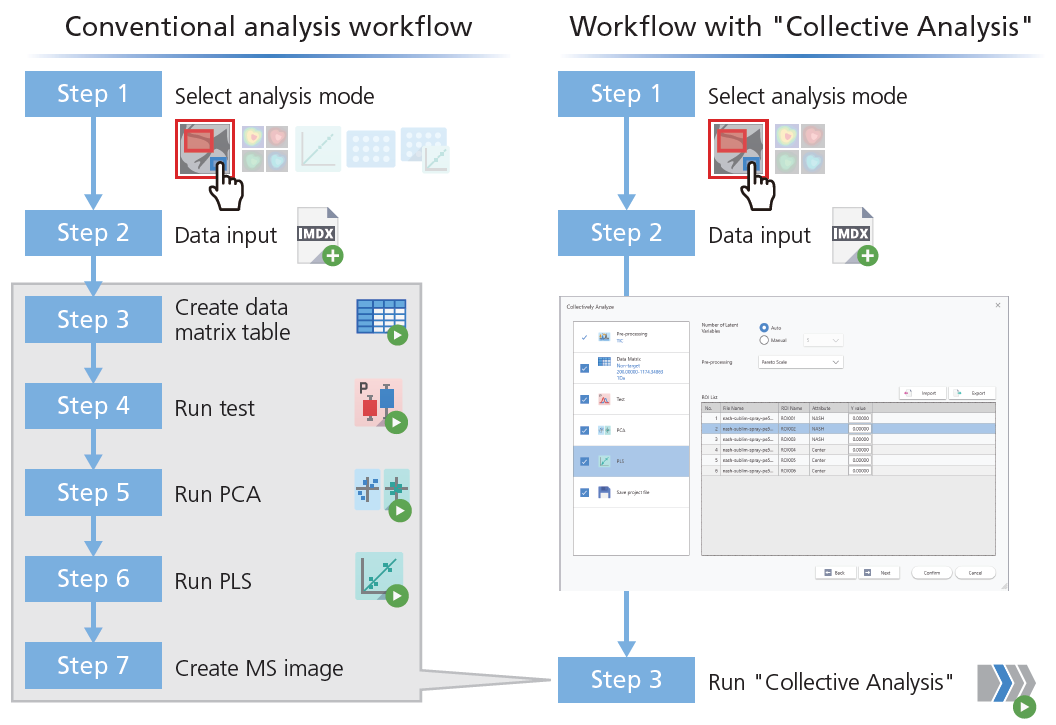
Processing in as few as 3 steps
"Collective Analysis" mode
Automatically obtain MS images with distinctive characteristics thanks to the "Collective Analysis" mode with pre-set parameters.
This is a highly convenient feature when you need to process a lot of data in the same way. The user can create data matrix tables from differential analysis and/or image analysis, carry out statistical data analysis, and obtain MS images all in one step.
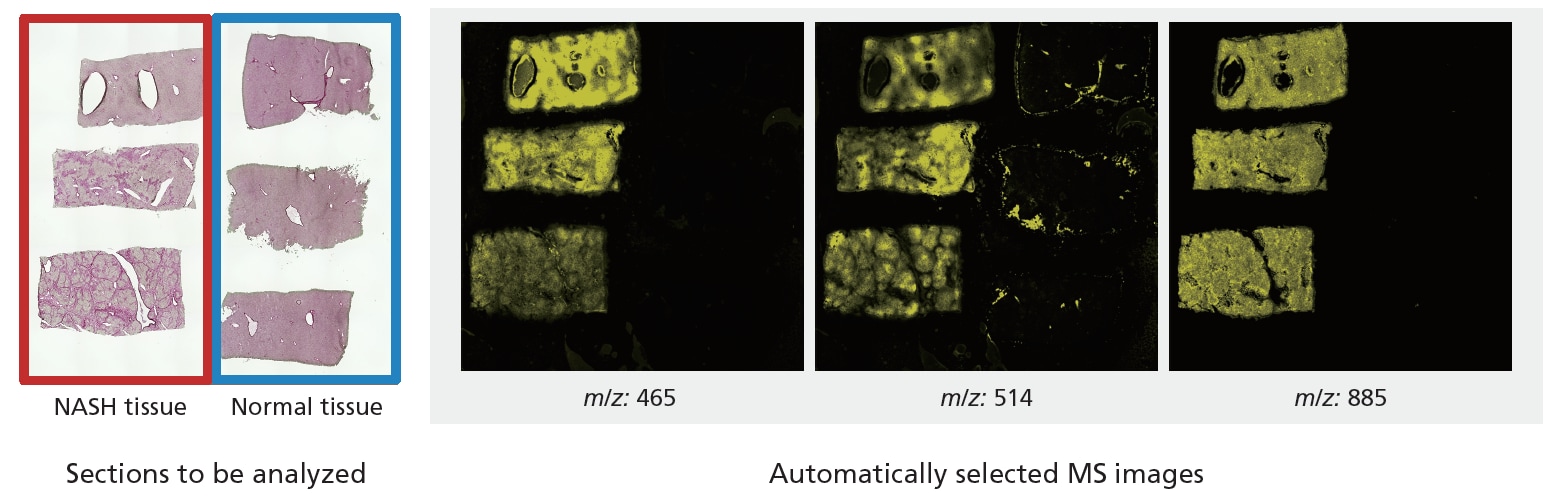
Examples using "Collective Analysis"
Using the "Collective Analysis" mode, MS images where the NASH tissue shows peculiarities with respect to normal tissue are automatically selected.
Multiple analysis modes
Introducing an analysis of mouse liver for NASH (Non-Alcoholic Steatohepatitis) using 3 examples of analysis modes.
- 1. Finding molecules unique to NASH tissue (Differential Analysis)
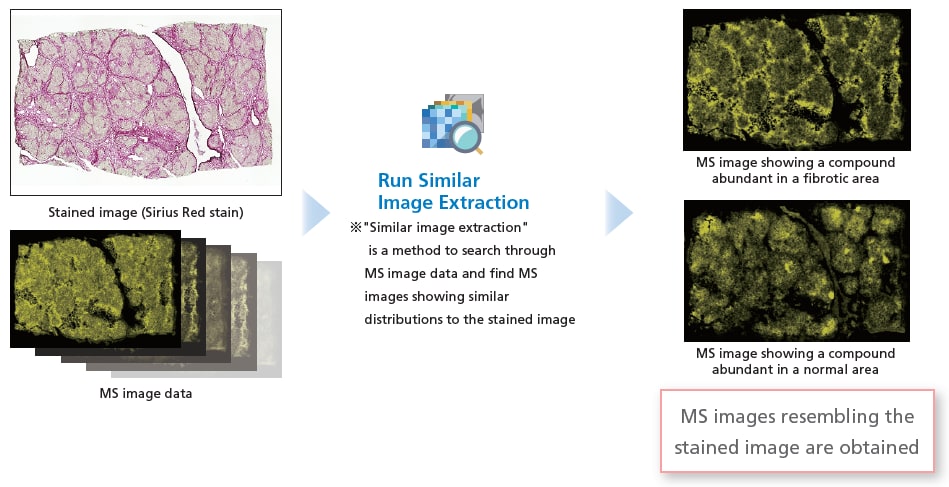
- 2. Finding molecules with the same distribution as the stained image (Image Analysis)
- 3. Creating an MS image showing the concentration distribution of the target molecule (Quantitative Analysis)
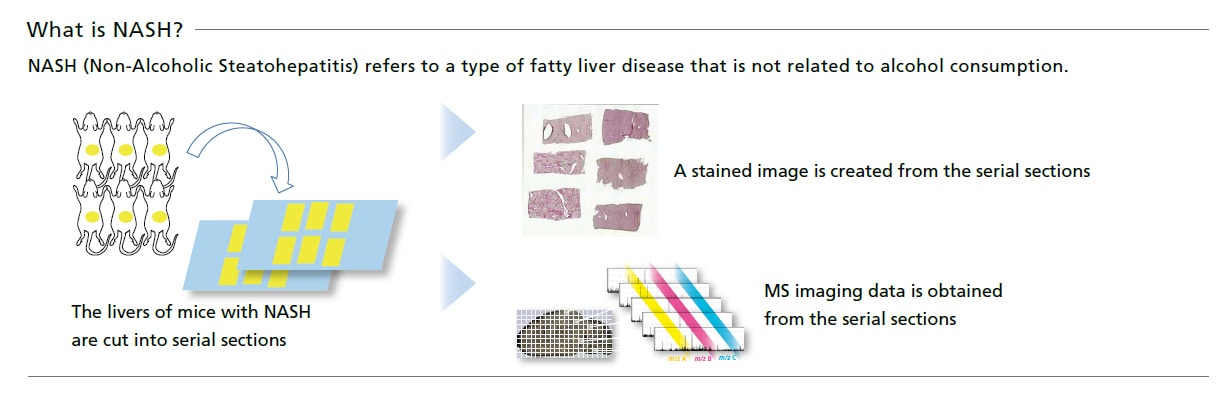
What is NASH?
NASH (Non-Alcoholic Steatohepatitis) refers to one type of fatty liver disease that is not related to alcohol consumption.
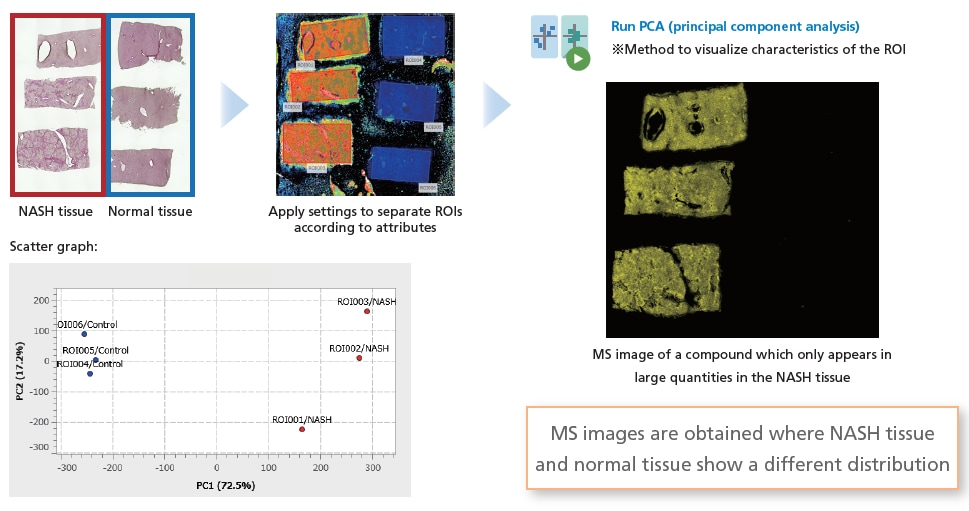
1. Finding molecules unique to NASH tissue Differential Analysis
Using statistical methods and comparing the average spectra of the ROIs, find molecules that are causing the differences between the ROIs.
2. Finding molecules with the similar distribution as the stained image Image Analysis
Using statistical methods and comparing each m/z distribution, find molecules with distinctive distributions.
Further data analysis can be carried out using "Image Classification", "Segmentation", etc.
3. *Pre-processing for Segmentation (UMAP)
A segmentation analysis is performed after pseudo-colorizing the data with UMAP as the pretreatment.*1
*1 When using UMAP, parallel processing is performed on the CPU, so the results of segmentation analysis may differ depending on the PC environment.
*Advanced optional license for image analysis (sold separately)
*Functions can be added by purchasing this optional license.
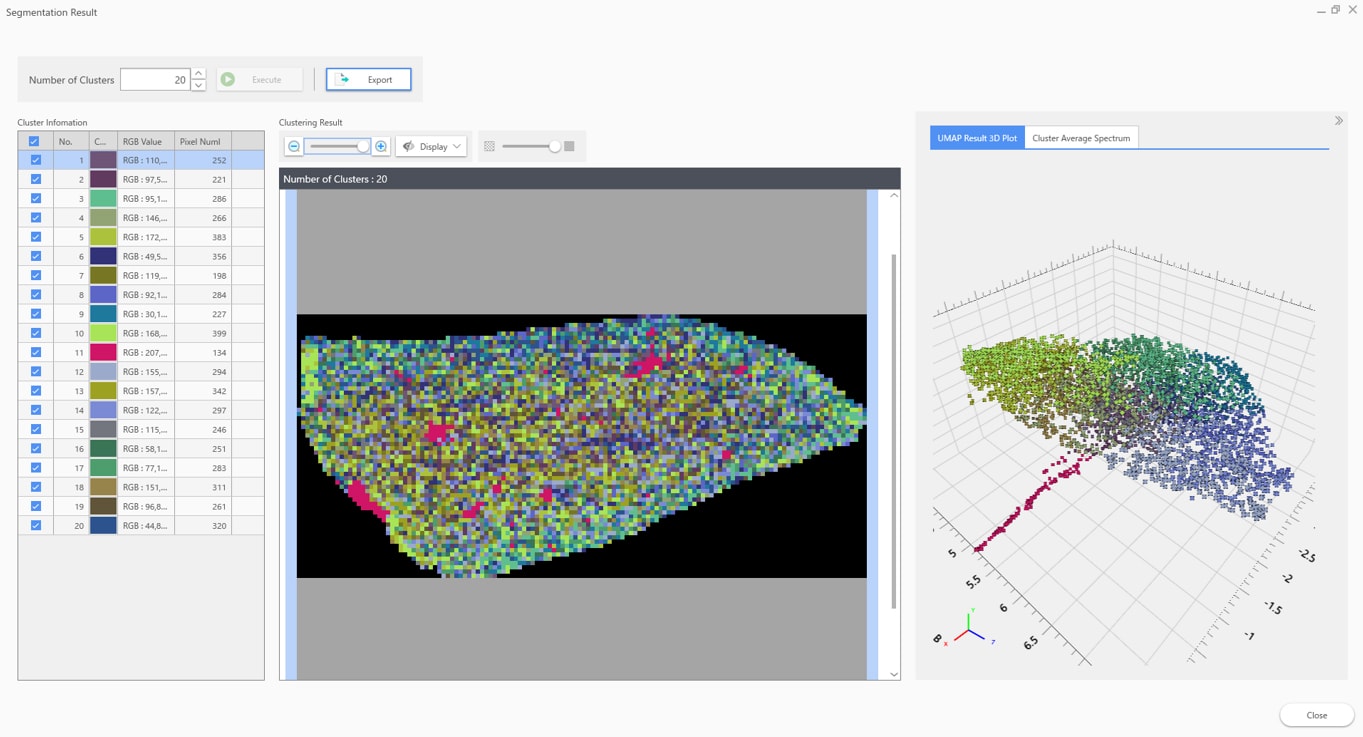
MS Imaging data is converted to a 3D map and then colored and segmented.
Red shows areas where bile acids appear strong.
4. Creating an MS image showing the concentration distribution of the target molecule Quantitative Analysis
Using calibration curves, convert the intensity of the target molecule in the ROI into a concentration value.

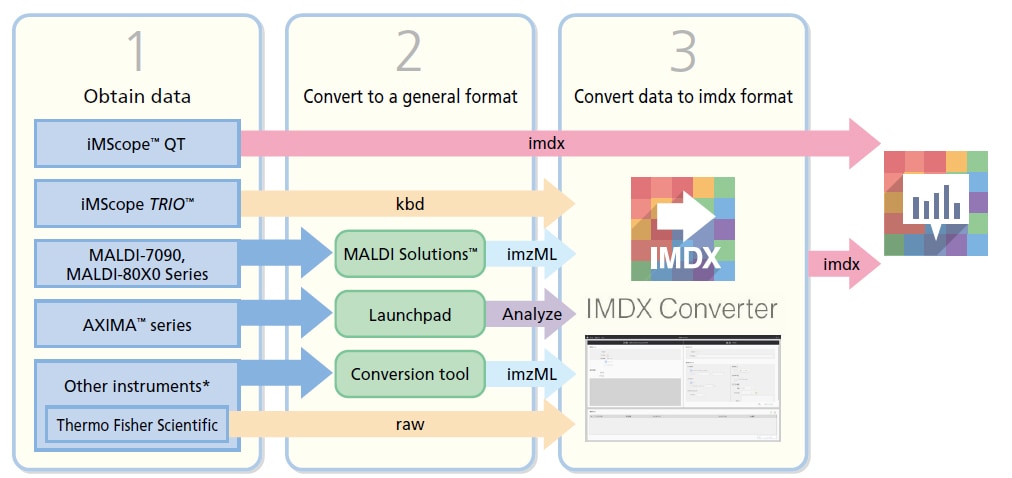
Processing of general data formats
Convert data files to imdx format readable by the IMAGEREVEAL MS using the included "IMDX Converter" tool.
The iMScope "kbd" format and general "Analyze 7.5" and "imzML" can be converted with this tool.
*The conversion of all data from other instruments is not guaranteed. Please refer to the product introduction website for the actual results of the data conversion.
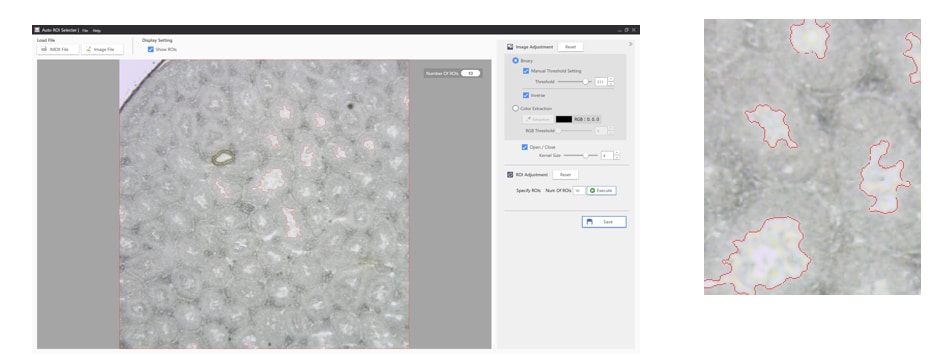
Auto ROI Selector
This tool creates ROIs from an image.
Complicated regions and large numbers of regions can be effortlessly specified as ROIs.
*Advanced optional license for image analysis (sold separately)
*Functions can be added by purchasing this optional license.
Other features
Target analysis / Non-target analysis
- Target analysis Analysis of only target m/z values based on a list of e.g. lipids or metabolites. It is also possible to create a custom list.
- Non-target analysis Analysis over all m/z within the specified MS range. Useful for checking which distinctive m/z values are contained within the range.
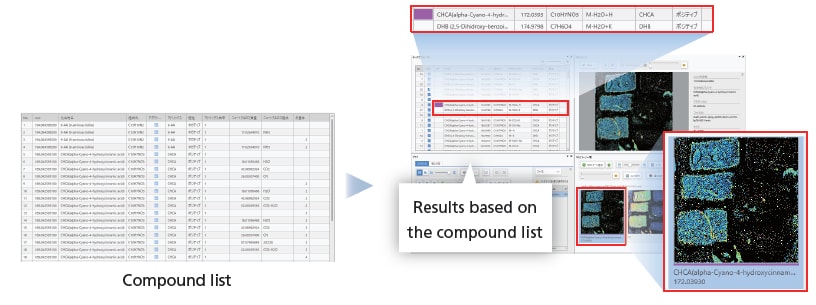
Compound list
This is a table containing information such as compound names, m/z values, and adduct ions. Using this table, you can associate compounds with m/z values to carry out MS image analysis.
Simultaneous processing of multiple MS Image data files
It is possible to process data from multiple data files all together, and by inputting all the data at once, it is simple to compare the images. Data analysis can be carried out on up to a few hundred GB without splitting up the data.