LCMS-9050


- Application of LabSolutions Insight Profiler as an innovative software tool for analysis of metabolomics data acquired from the profiling of blood samples from paediatric patients with SARS-CoV-2 or influenza A compared to controls. - Metabolomics revealed statistically significant phenotypic differences in cases and controls including 75 features significant by ANOVA that could be putatively identified as metabolites or lipids by MS/MS library matching. - The application delivers an end-to-end solution for untargeted metabolomics, automating complex data processing.
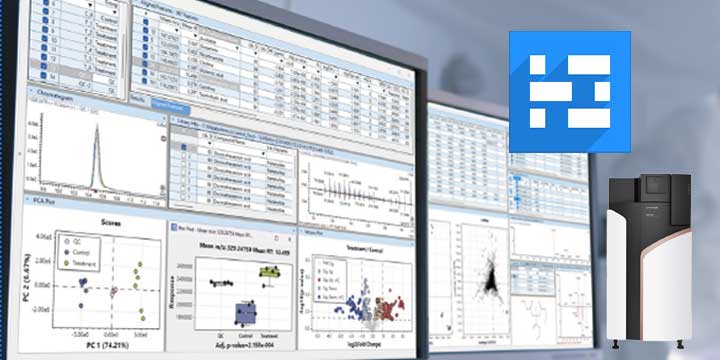
LabSolutions Insight Profiler is a dedicated software package to streamline workflows for QTOF data analysis, providing an end-to-end solution for metabolomics. A single processing method is set up to perform feature detection and alignment, data filtering, statistical analysis and compound identification. In this application, LabSolutions Insight Profiler was used to analyse metabolomics data acquired to study acute respiratory illnesses (ARIs). ARIs are a leading cause of morbidity and mortality in paediatrics; however, diagnosis and prognosis can be challenged by children presenting with similar clinical symptoms, regardless of the underlying infection. Being able to distinguish between infections caused by viruses such as SARS-CoV-2 and influenza could lead to a more accurate diagnosis and clinical outcome. In this study, metabolomics analysis of blood samples from children admitted to hospital with an ARI later diagnosed as either SARS-CoV-2 or influenza infection were compared to controls with the aim of phenotyping disease profiles. The untargeted metabolomics workflow was applied to acquire high-resolution accurate mass data to profile each sample with data independent acquisition (DIA)-MS/MS. Data were processed in LabSolutions Insight Profiler to find potential biomarkers of ARIs. Fig. 1 highlights an example of a boxplot for a lipid identified in the software as being statistically significant in cases versus controls.
October 19, 2026 GMT
Some products may be updated to newer models